2026-07-25 22:01:25
Welcome to the Saturday PRO edition of How They Make Money.
Over 300,000 subscribers turn to us for business and investment insights.
In case you missed it:
📊 Monthly reports: 200+ companies visualized.
📩 Tuesday articles: Exclusive deep dives and insights.
📚 Access to our archive: Hundreds of business breakdowns.
📩 Saturday PRO reports: Timely insights on the latest earnings.
Today at a glance:
🏭 Intel: Fifteen-Year High
⚡ GE Vernova: Capacity Bet
⚙️ Texas Instruments: Pricing Lever
💳 Amex: Platinum Premium
📶 T-Mobile US: Momentum Cools
🌐 IBM: Mainframe Air Pocket
📡 Verizon: Subsidy Pullback
🏦 Schwab: The Volatility Dividend
📞 AT&T: Volume Over Price
🛰️ Lockheed Martin: The Missile Surge
🧑💻 ServiceNow: Growth Without Credit
💼 Moody’s: Volume Over Mix
🚗 GM: Pricing Over Volume
🍕 Domino’s: Ticket Miss
🦅 American Airlines: Fuel Eats The Record
🍿 AMC: The Odyssey Delivers

Intel’s Q2 revenue rose 25% Y/Y to $16.1 billion ($1.7 billion beat), and non-GAAP EPS was $0.42 ($0.20 beat), against a $0.10 loss a year ago. CEO Lip-Bu Tan called it the strongest revenue growth in more than fifteen years.
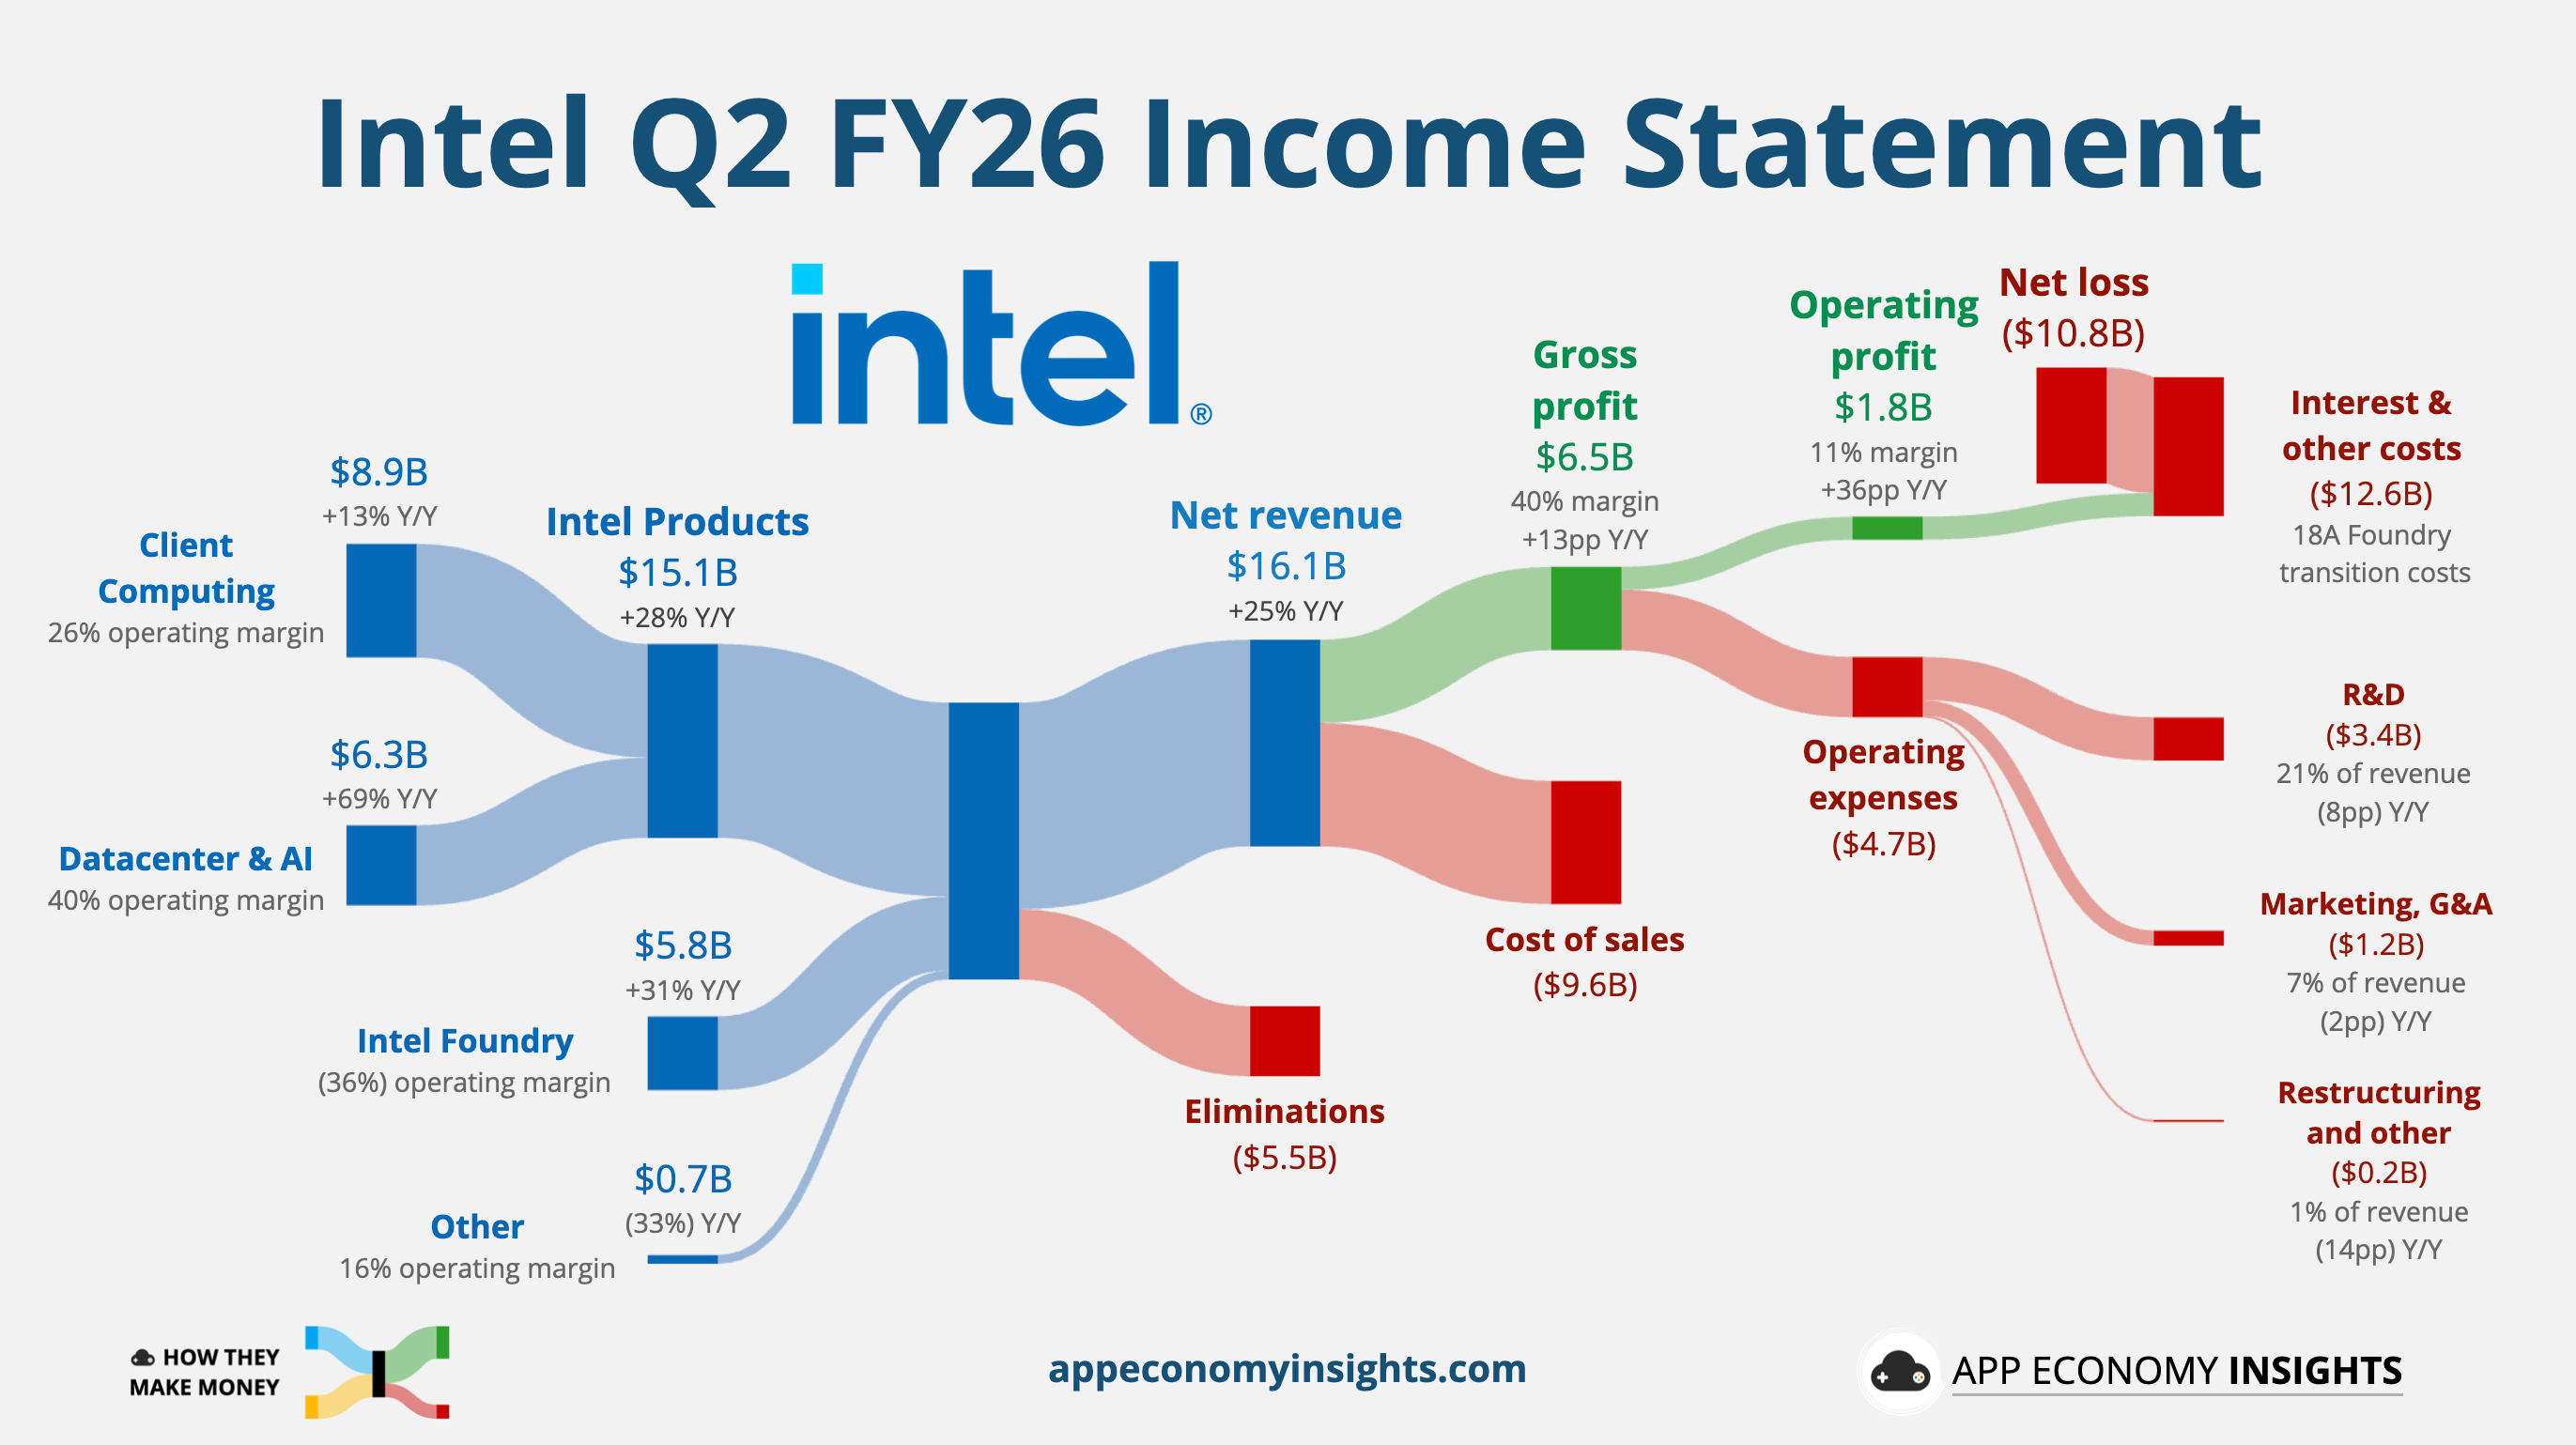
Intel lost $10.8 billion on paper because its own stock price went up so fast that it made the free shares it promised the US government way more expensive to give away. INTC has nearly tripled this year but sits close to 30% below its June 22 high. The stock was caught in a sector-wide rotation out of chip stocks as Wall Street questions whether AI hardware spending is sustainable.
Data Center and AI revenue climbed 59% Y/Y to $6.3 billion, more than double Intel’s overall growth rate, as agentic workloads pull the stack back toward CPUs.
Client Computing rose 13% Y/Y to $8.9 billion against an $8.0 billion consensus, with AI PCs now two-thirds of the client mix.
Foundry grew 31% Y/Y to $5.8 billion, accelerating from 16% last quarter, and adjusted gross margin hit 41.8%, roughly 280 basis points above guidance.

CFO Dave Zinsner said rising memory prices will hit the PC business in the coming quarters, and management already expects sub-seasonal PC consumption in the second half. Intel is spending into that anyway, raising 2026 CapEx from $18 billion to more than $20 billion. Management expects 2027 CapEx to be significantly higher. Foundry's growth is still mostly internal. The segment sells almost entirely to Intel's own product groups, and CEO Lip-Bu Tan wouldn't name external customers, pointing to early next year for visible progress.
Q3 guidance of $15.8–16.8 billion implies a midpoint roughly $1.2 billion above consensus, with EPS of $0.38 (vs. ~$0.27 expected) and gross margin of 42% (vs. ~40% consensus). Zinsner said Intel can sell every data center chip it makes, 18A yields are running ahead of plan, and 14A will move to volume production in 2028. Client Computing is the segment to watch in Q3, when higher memory costs hit PC pricing.
2026-07-24 20:03:09
Welcome to the Free edition of How They Make Money.
Over 300,000 subscribers turn to us for business and investment insights.
In case you missed it:
Tomorrow, we’ll break down 16 key reports for PRO members, including IBM's worst single-session drop ever and ServiceNow fighting the SaaSpocalypse narrative.
Today, we look at Tesla’s earnings and Uber’s biggest acquisition yet.
🚖 Tesla: Cash Burn Begins
■ Uber: The $15 Billion Order

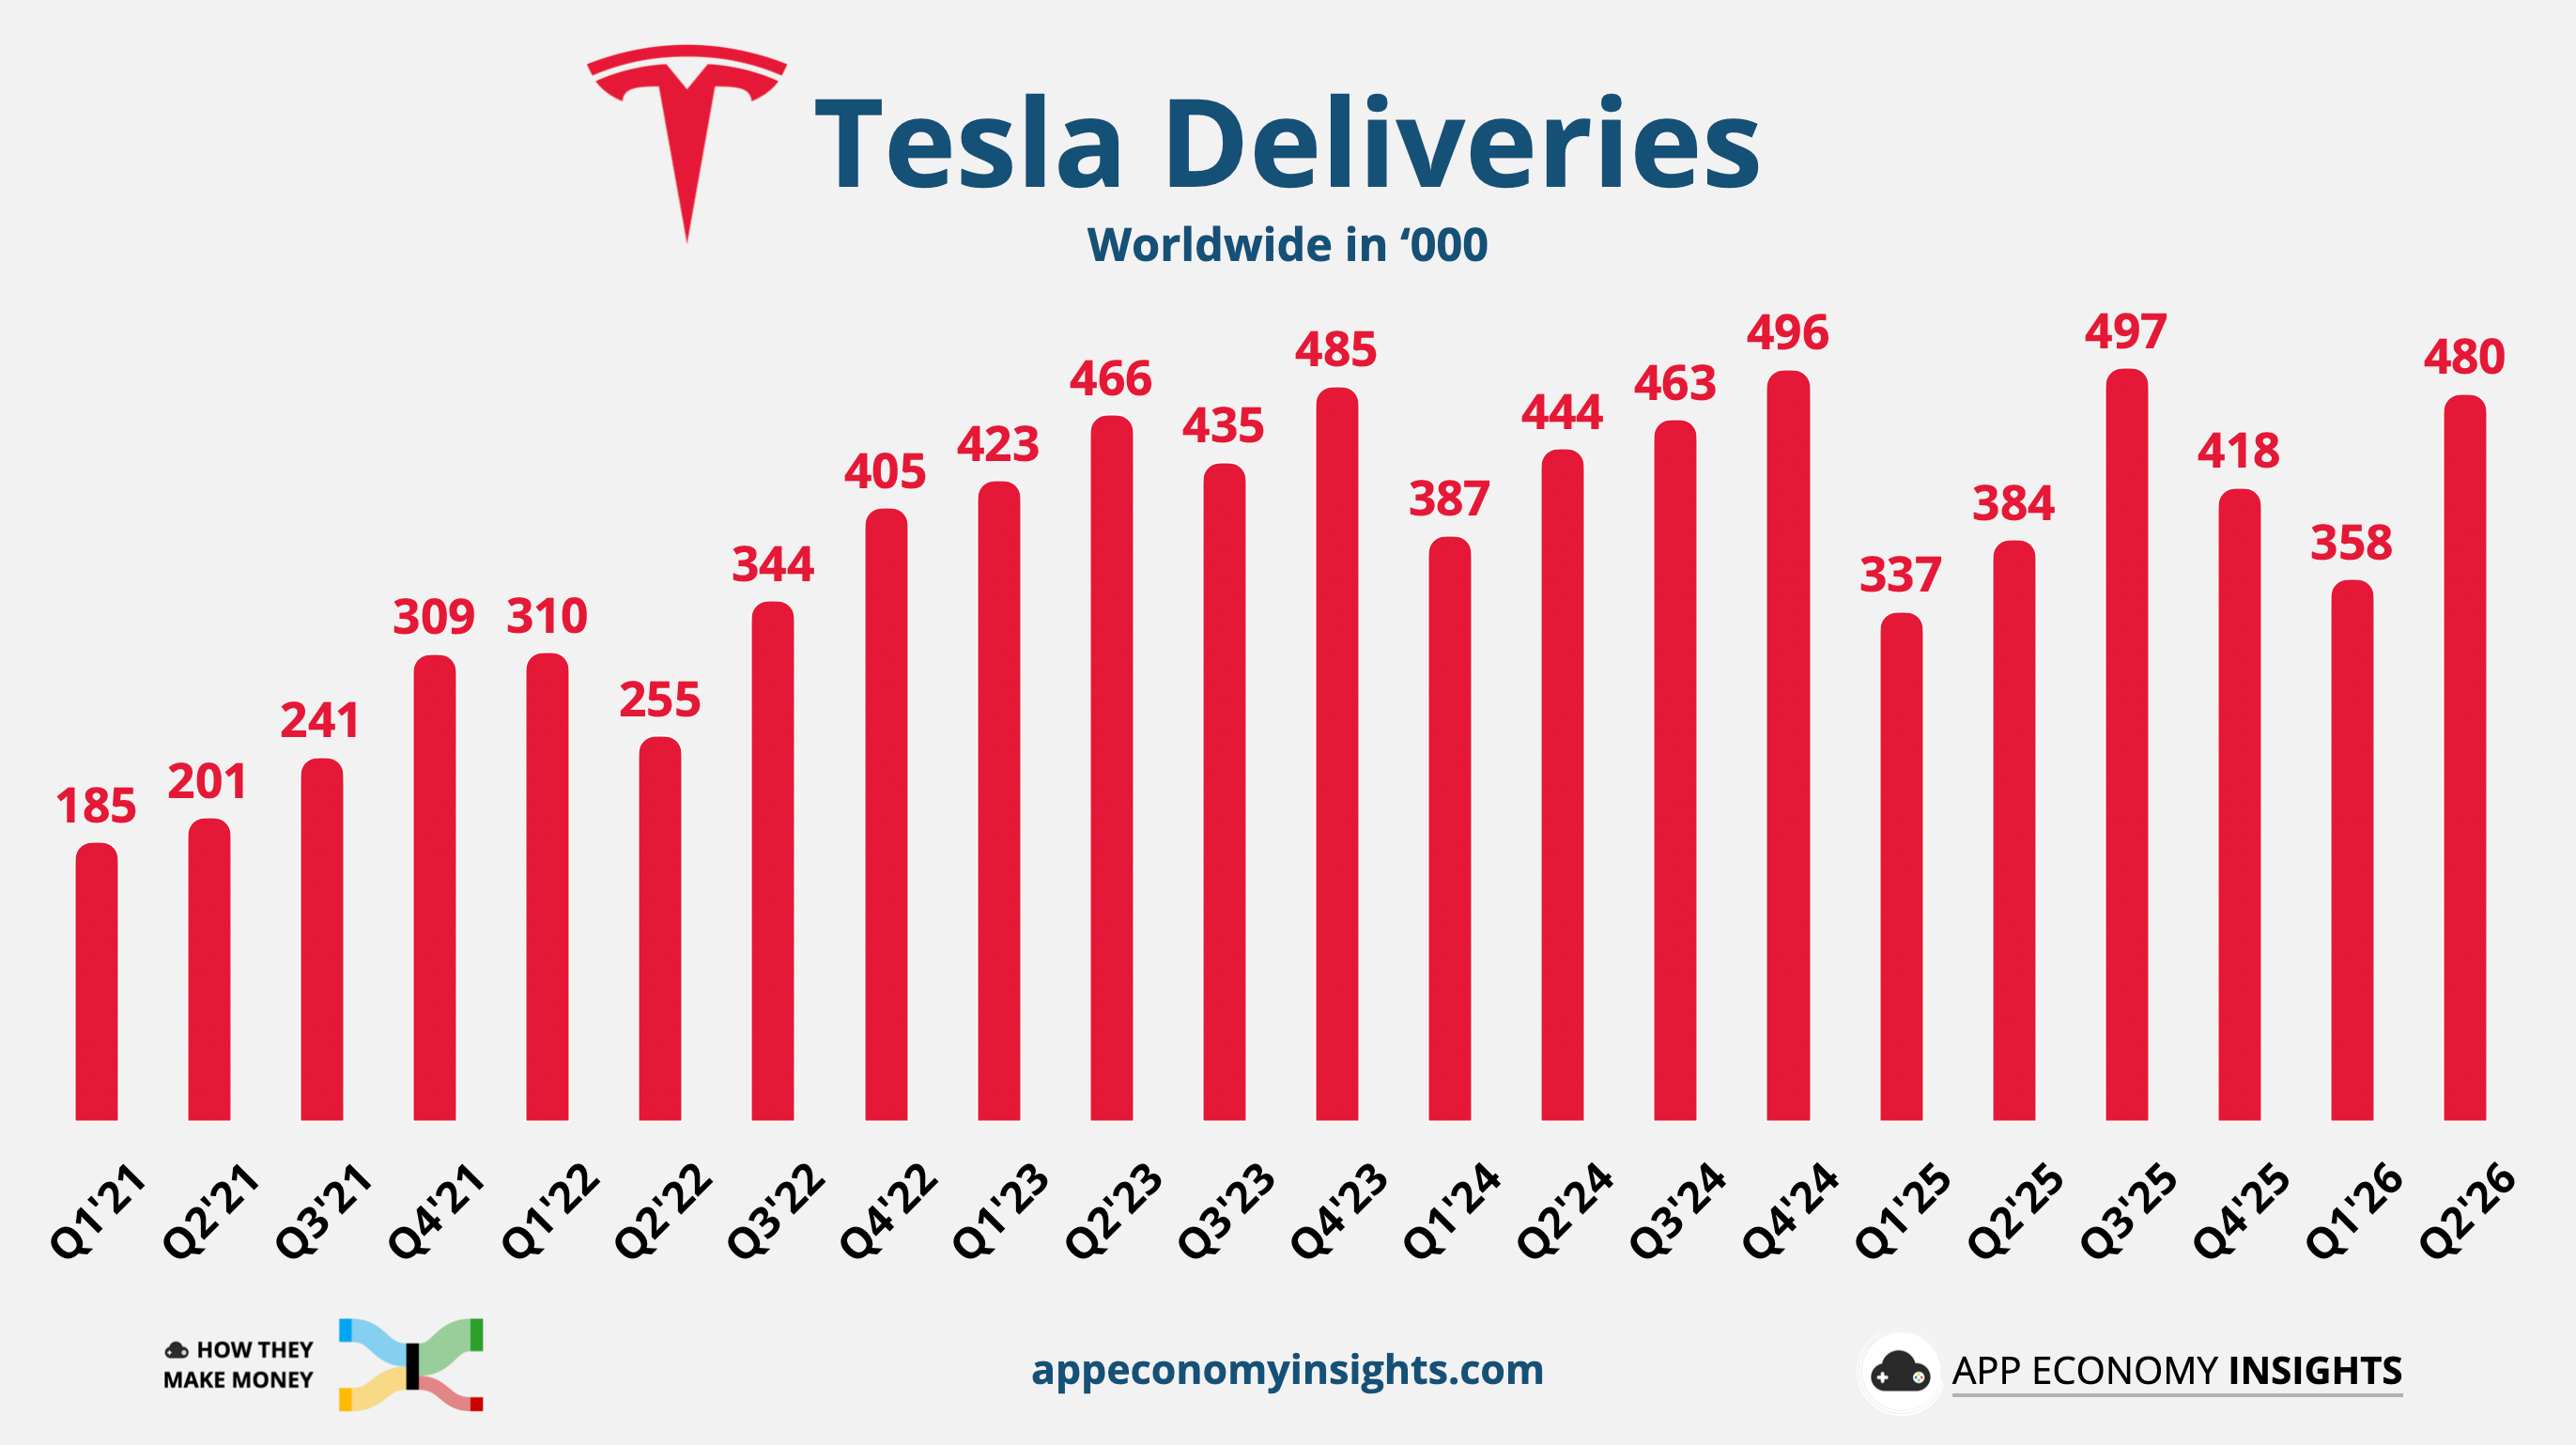
Tesla got its demand mojo back. Deliveries hit a Q2 record of 480K vehicles, and trailing-twelve-month revenue crossed $100 billion for the first time.
Yet shares plunged nearly 14%, their worst post-earnings decline since 2013.
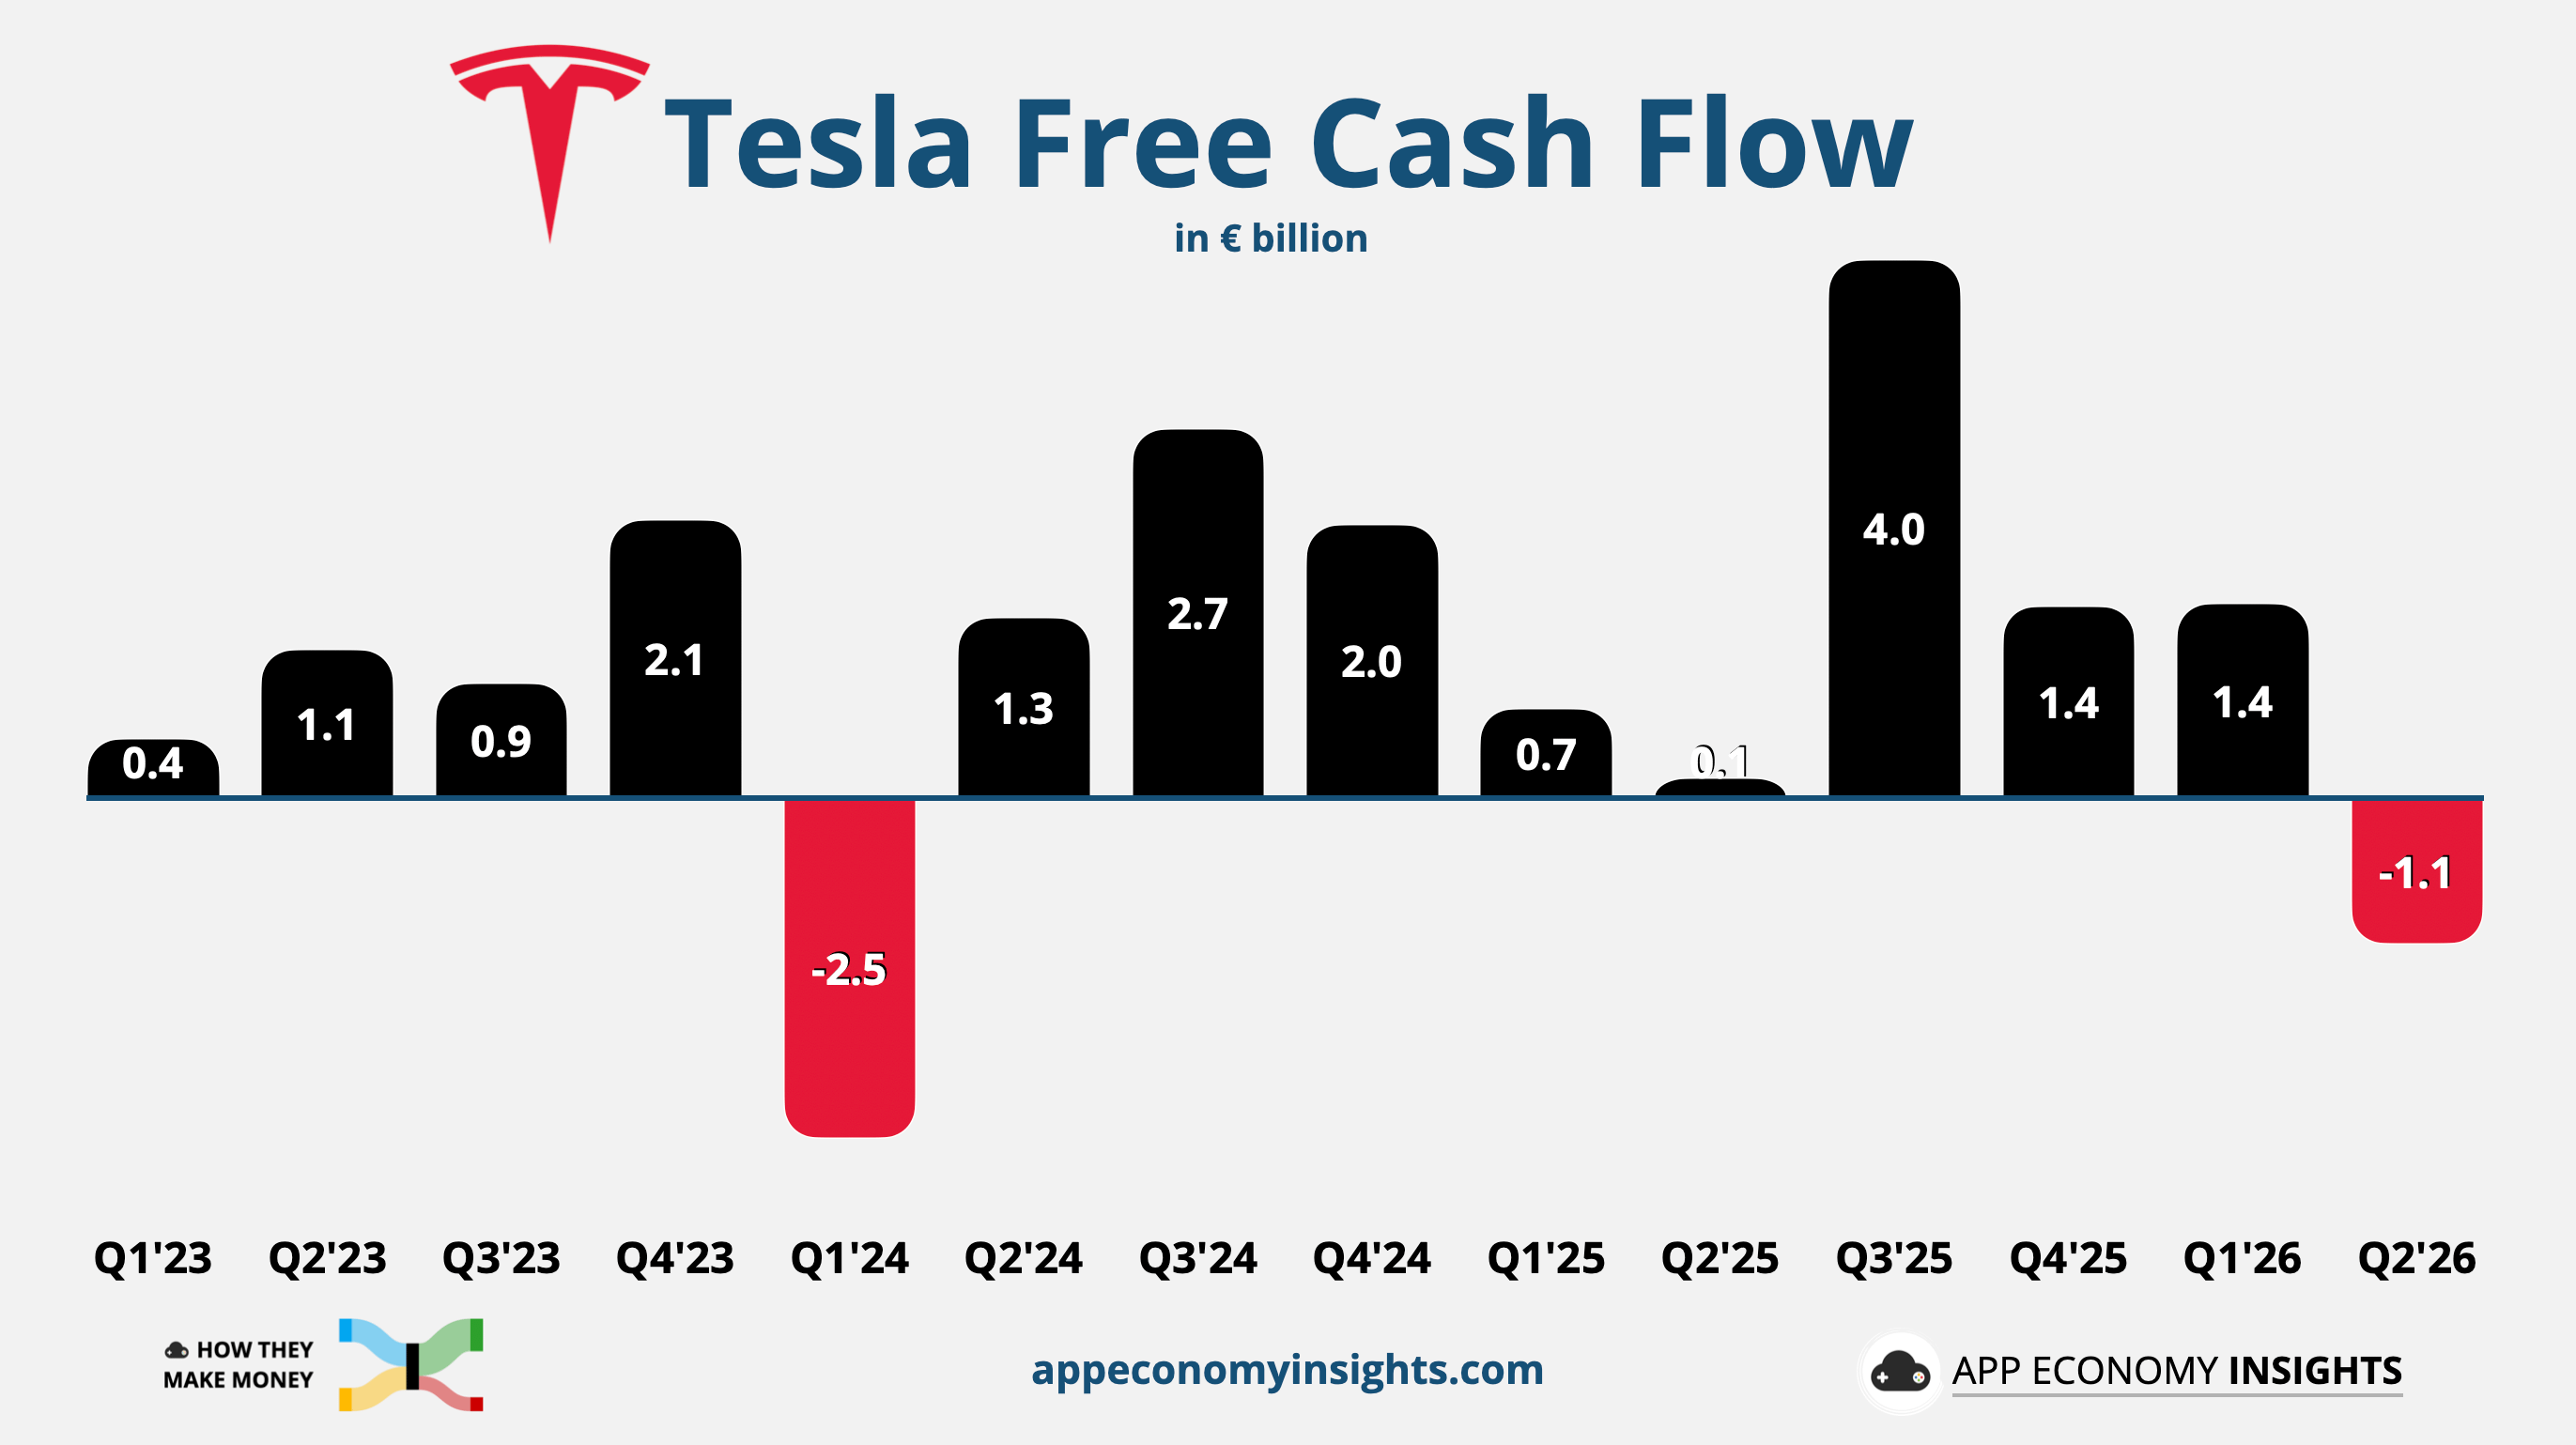
Operating profit fell 57% to just $398 million, while free cash flow turned negative. Last quarter, we flagged that Q1’s margin beat leaned on one-time items and that Tesla’s $25 billion CapEx cycle would push free cash flow negative. Both arrived in Q2.
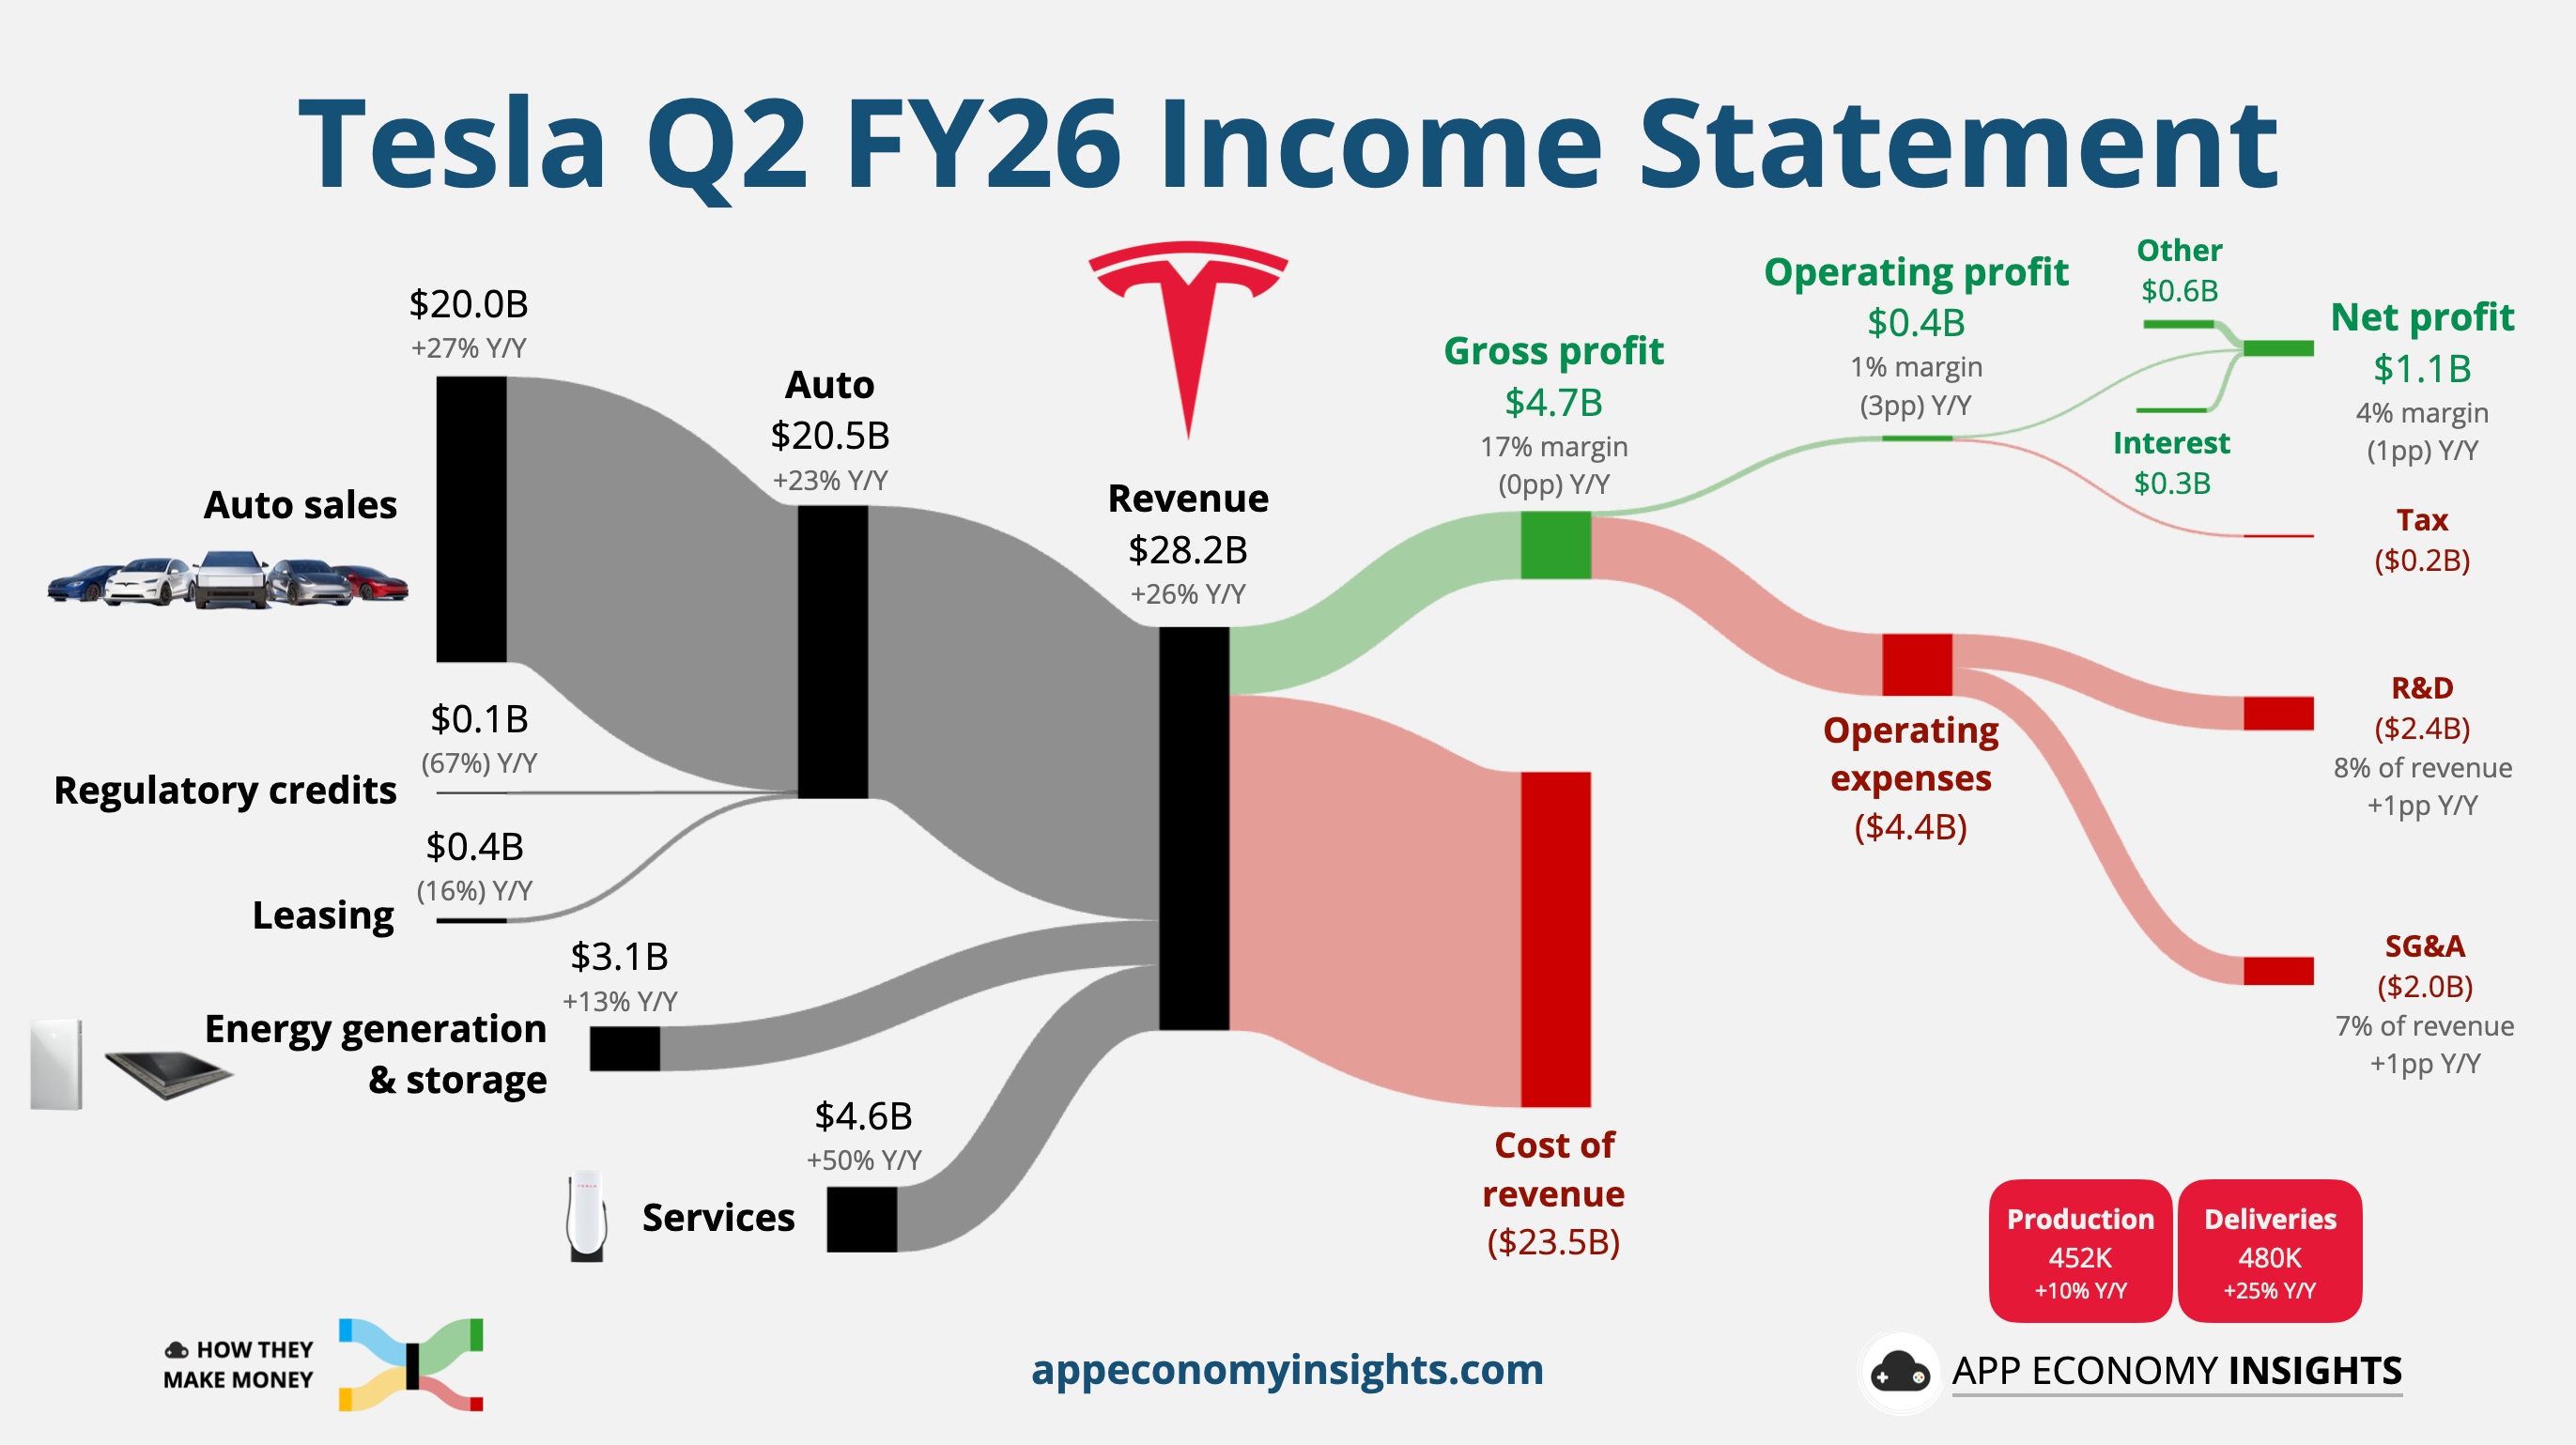
Revenue grew 26% Y/Y to $28.2 billion ($1.7 billion beat).
Gross margin was 17% (-0pp Y/Y and -4pp Q/Q).
Operating margin fell to 1% (-3pp Y/Y).
Non-GAAP EPS was $0.33 ($0.21 miss).
Operating cash flow grew 85% Y/Y to $4.7 billion.
Free cash flow swung from positive $0.1 billion last year to negative $1.1 billion as CapEx jumped 142% to $5.8 billion
Tesla again withheld full-year guidance. CapEx will exceed $25 billion this year (outlook unchanged), and keep growing for another two to three years as Tesla expands Robotaxi, Optimus, AI compute, semiconductor, solar, and manufacturing capacity.
Management is also securing debt facilities that could provide up to $30 billion of borrowing capacity. Tesla still has $43.5 billion of cash and investments, but debt is becoming part of the funding plan.
🚘 Demand came back: Automotive revenue grew 23% Y/Y to $20.5 billion as deliveries increased 25% to 480K, roughly 74K above the company-compiled consensus. Tesla also said it exited Q2 with its largest order backlog since 2023. Management called FSD a major demand driver, with nearly 1.5 million paid customers and attach rates above 55% on new North American deliveries. The constraint has now shifted toward supply, particularly batteries and electronic components.
⚡️ Energy delivered volume, but not margin: Storage deployments reached 13.5 GWh, up 41% Y/Y and 53% sequentially, making Q2 Tesla’s second-largest quarter ever. But energy gross margin fell from 40% to 20% because of a $240 million warranty adjustment, the absence of Q1’s tariff benefit, and falling industrial-storage prices. Management expects margins to settle in the low-to-mid 20s.
🔌 Services quietly became the bright spot: Services revenue jumped 50% Y/Y to $4.6 billion, while gross margin climbed from 9% to a record 14%. Growth came from used vehicles, Supercharging, service centers, and insurance. These are no longer negligible side businesses.
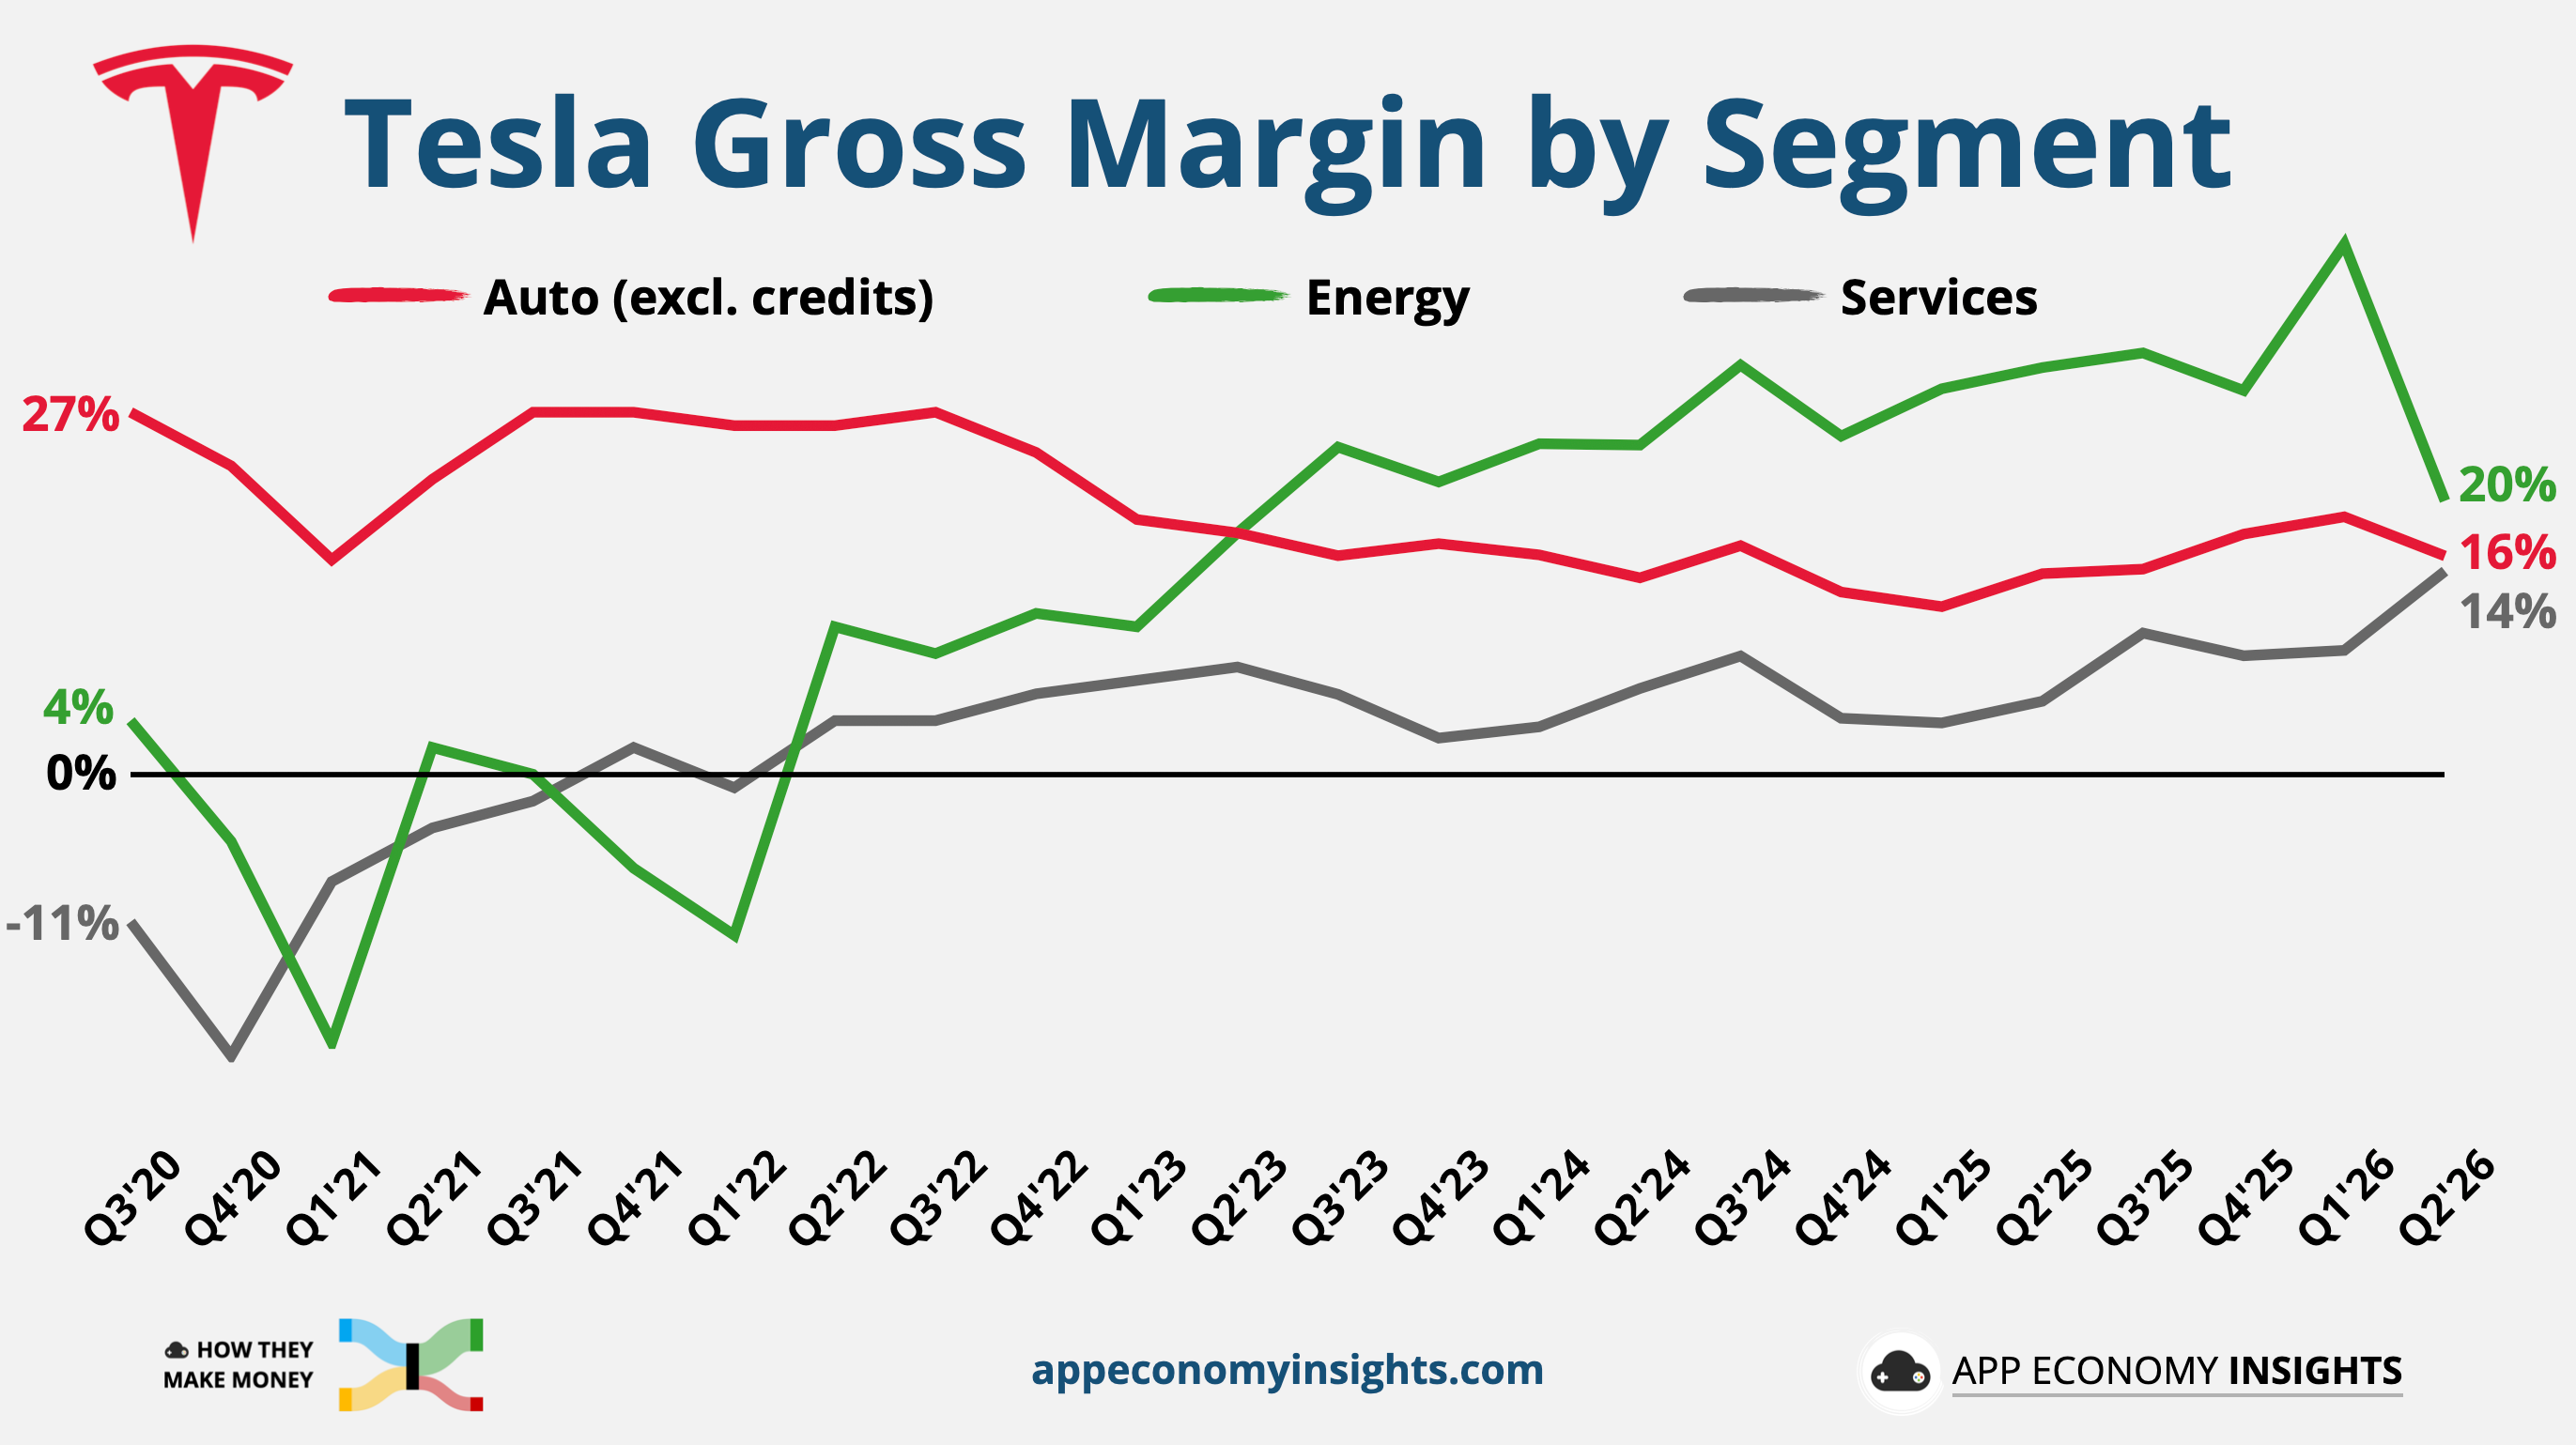
📉 Q1’s margin support disappeared: Automotive gross margin excluding credits fell from 19% to 16%. Q1 included a $230 million warranty benefit and tariff relief that did not repeat, and management said underlying margins were roughly flat after adjusting for them. Meanwhile, operating expenses rose 47%, primarily due to AI, pre-production R&D, and stock-based compensation. It left operating profit at roughly one-quarter of consensus. Net profit of $1.1 billion looked healthier, but included a $1.0 billion unrealized gain on Tesla’s SpaceX stake.
💸 Cash burn begins, and debt enters the plan: CapEx more than doubled sequentially to $5.8 billion, pushing free cash flow to negative $1.1 billion. Tesla spent just $8.3 billion in the first half, so its greater-than-$25-billion outlook implies at least $16.7 billion in H2—more than double H1. Tesla has ample liquidity, but the funding model is changing. The company is preparing to add leverage.
🚖 Robotaxi keeps a limited scale: Robotaxi now operates in seven metros. Tesla says its unsupervised fleet has driven more than 380K miles across six cities, with weekly mileage growing at a double-digit rate. But Tesla remains early: Waymo has already accumulated roughly 220 million autonomous miles. Cybercab has entered production and is accumulating the calibration miles required to scale.
🤖 Optimus remains the hardest ramp: Tesla is replacing the Model S and X lines at Fremont with its first Optimus production lines. Musk called it the hardest manufacturing ramp Tesla has attempted, warning that the early portion of the production curve will be “flat and long.”
Bottom Line: Tesla delivered a strong quarter for demand, but investors rejected the economics. The nearly 14% sell-off shows the market is becoming less willing to let future AI opportunities offset weak current profits.
Tesla may be right to spend aggressively if Robotaxi, Optimus, and its AI infrastructure produce the returns Musk expects. But more than two-thirds of this year’s CapEx is still ahead, while the businesses meant to justify it have yet to contribute meaningfully to earnings. Tesla has the balance sheet to finance the wait, but the market remains skeptical.
Uber is making its biggest acquisition yet: $15 billion for a global delivery footprint it could not build market by market.
On July 16, Uber agreed to acquire Delivery Hero, the Berlin-based group behind foodpanda, Glovo, talabat, and Korea’s Baemin. The company will pay €41.50 per share in cash, up from the €33 it floated in May.
Uber already owned 25% outright and held another 12% of economic exposure through financial instruments. Prosus has irrevocably committed its remaining 17%, taking Uber’s economic interest to roughly 53% before other shareholders tender.
Why now? Delivery Hero gives Uber leading local brands across Asia, Latin America, the Middle East, and parts of Europe. Uber will acquire businesses in 50 markets that generated $42 billion in gross bookings last year once you carve out 14 overlapping markets.
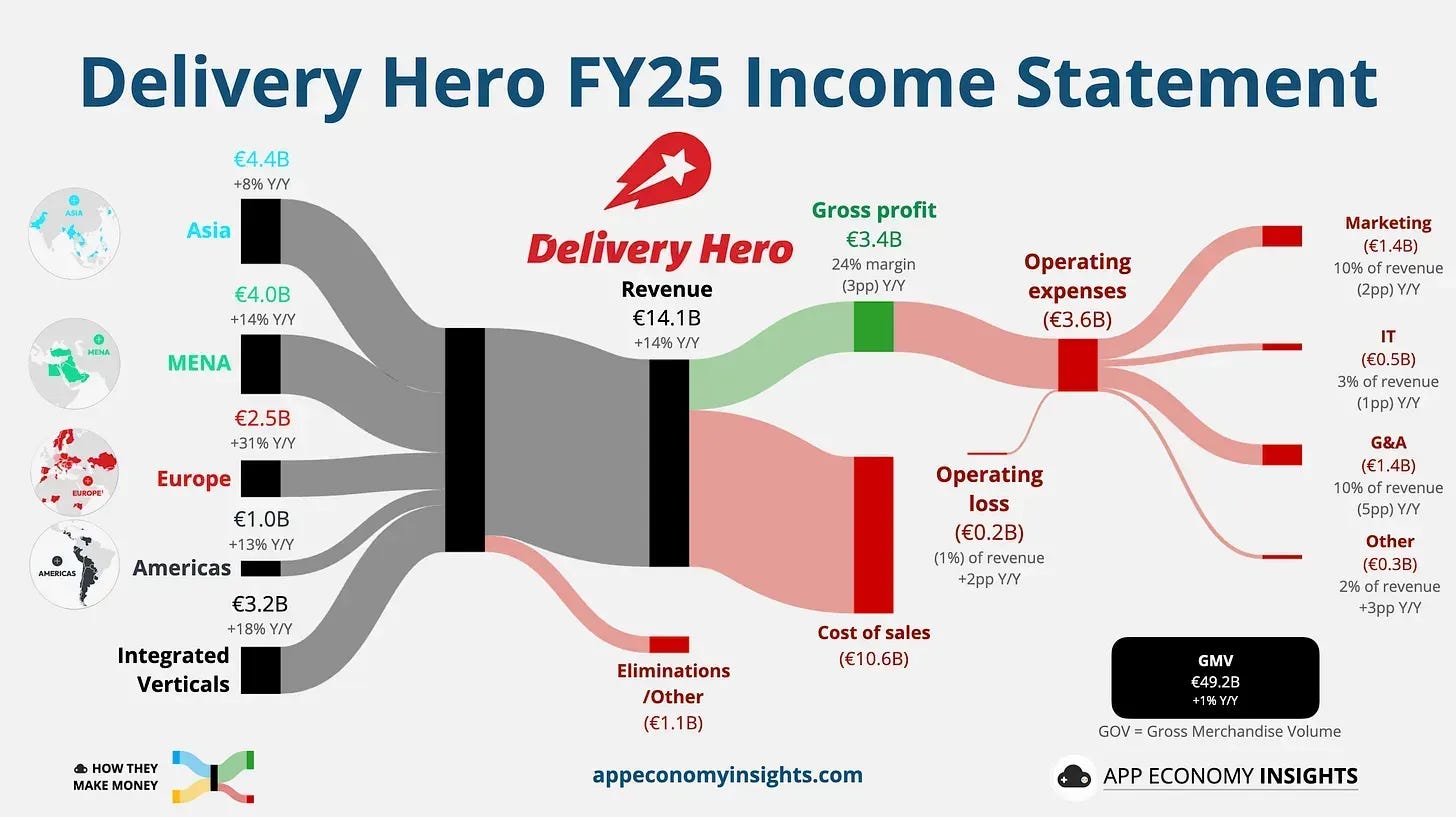
Uber wants to connect Delivery Hero’s customers with its mobility network. Uber’s platform will expand from 79 to 99 markets, with combined 2025 gross bookings of $236 billion. The number of markets where it runs both rides and delivery will nearly double, from 34 to 58.
Uber says cross-platform users generate ~3x the gross bookings and profits of customers using only one service, while acquiring them through an existing platform costs more than 50% less than paid marketing. A food customer can become a rider, a rider can become a food customer, and Uber One becomes more useful to both.
The price looks steep at ~14x EBITDA before synergies for a sprawling, relatively low-margin delivery business. But Uber CFO Balaji Krishnamurthy is targeting $1.2 billion in run-rate synergies within 18 months, mostly from moving Delivery Hero onto Uber’s tech stack. If Uber captures the full $1.2 billion, management says its effective multiple falls to ~8x 2027 adjusted EBITDA. Uber calls the deal accretive to non-GAAP EPS from close.
Why it matters
The scale game: DoorDash bought Deliveroo. Prosus took Just Eat Takeaway. Food delivery rewards density, and the last independents are running out of room to stay independent.
The regulatory tax: Uber pre-sold 14 overlapping markets (including Türkiye, Spain, Poland, and others) to SSW Partners for ~$1.6 billion to ease antitrust review. A second-half-2027 target close tells you Brussels won’t wave this through.
The AV hedge: There is also a defensive angle. A much larger delivery network gives Uber another source of demand and customer engagement if autonomous competitors eventually pressure the economics of ride-hailing.
Bottom Line: Uber paid up for a target whose largest shareholders wanted an exit, then structured the deal to improve its odds with regulators. If the promised $1.2 billion of synergies arrives, the effective 8x multiple could look compelling. But it does come with some execution risks The integration will not begin until the deal closes, likely in late 2027.
That’s it for today!
Stay healthy and invest on.
Thanks to Fiscal.ai for being our official data partner. Create your own charts and pull key metrics from 50,000+ companies directly on Fiscal.ai. Start an account for free and save 15% on paid plans with this link.
Author’s Note (Bertrand here 👋🏼): The views and opinions expressed in this newsletter are solely my own and should not be considered financial advice or any other organization’s views.
Disclosure: I am long TSLA, UBER, GOOG, and NVDA in the App Economy Portfolio. I share my ratings (BUY, SELL, or HOLD) with App Economy Portfolio members.
2026-07-23 08:16:56
Welcome to the Premium edition of How They Make Money.
Over 300,000 subscribers turn to us for business and investment insights.
In case you missed it:

Alphabet just reported $112 billion in net profit on $120 billion in revenue.
That’s not a typo. The explanation is a $99 billion paper gain on equity investments, largely reflecting revaluations of Alphabet’s stakes in Anthropic and SpaceX.
Strip that out, and the operating quarter was still exceptional. AI demand is outrunning Google’s capacity, but the cost of catching up is rising just as fast.
Here’s what stood out this quarter.
Today at a glance:
Alphabet Q2 FY26.
Funding the machine.
Key Insights from the call.
What to watch moving forward.
Alphabet disclosed a $99 billion paper gain from its equity investments along with small items under other income.
Anthropic’s post-money valuation rose from $380 billion to $965 billion in three months. Alphabet reportedly owns roughly 14%, making Anthropic an obvious contributor to the gain. But Alphabet did not disclose the contribution from each investment, and SpaceX’s June IPO also created a public-market price for a stake Alphabet has held since 2015.
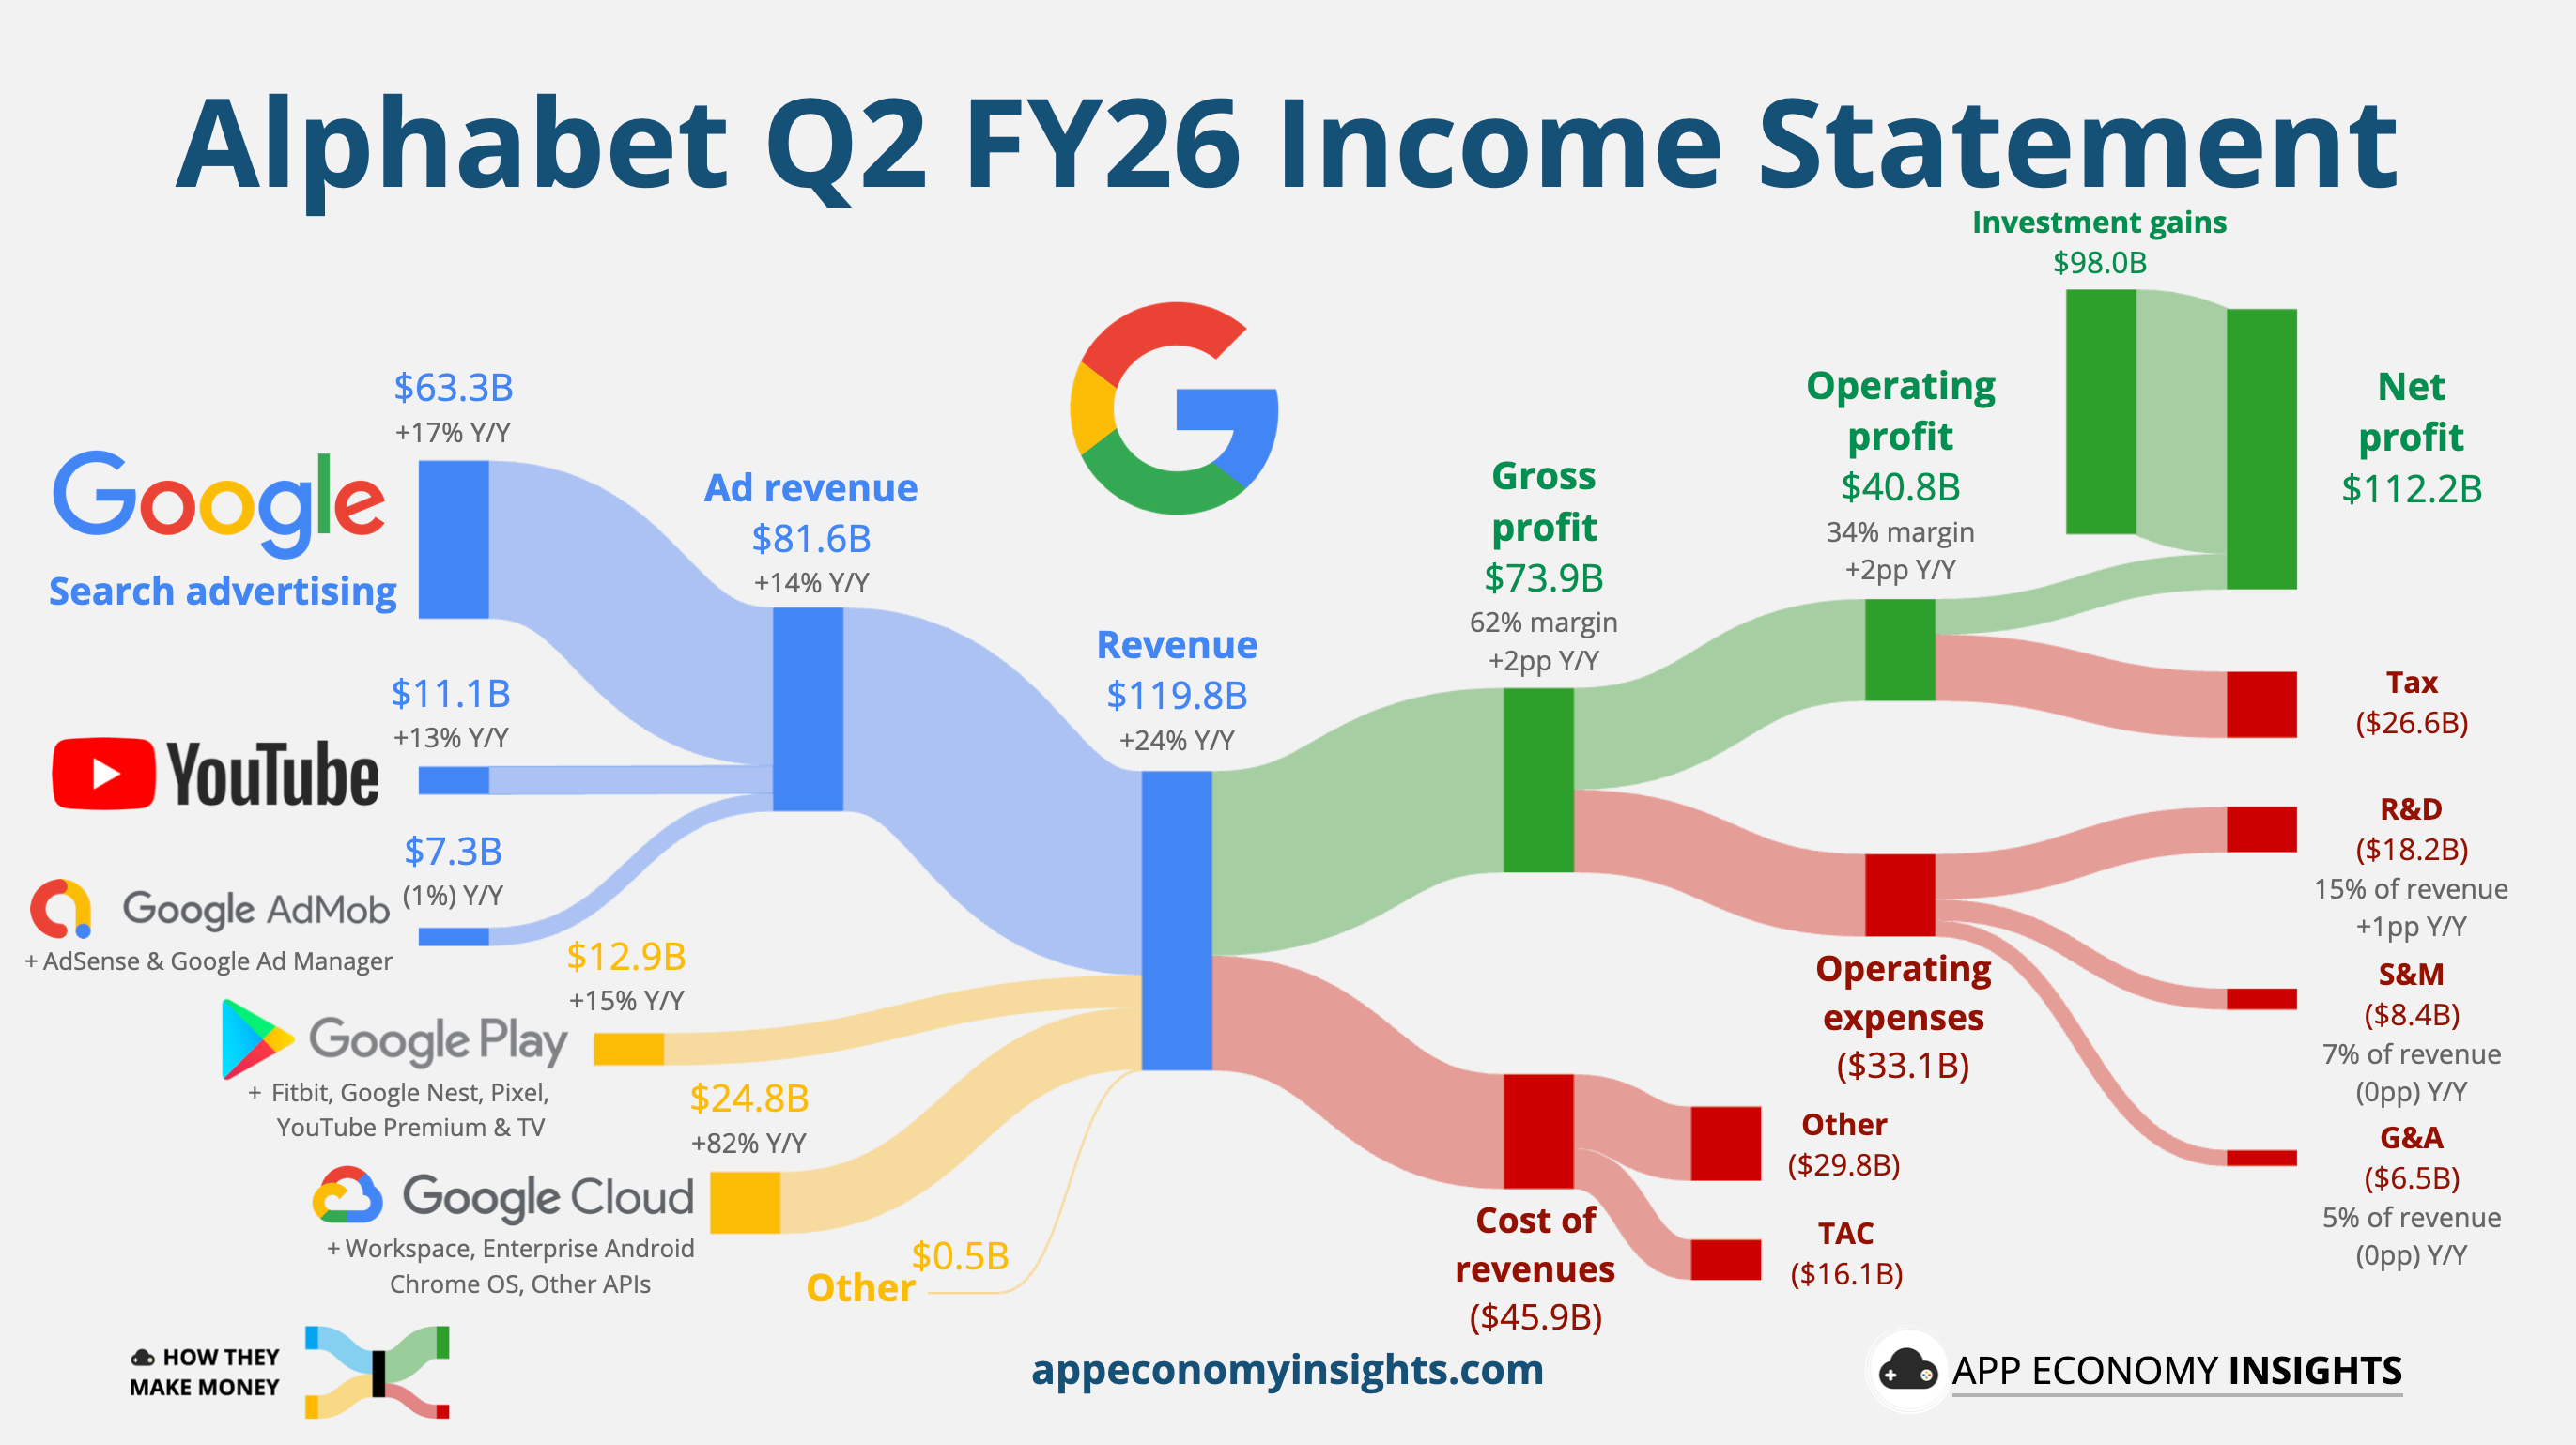
Revenue grew 24% Y/Y to $119.8 billion ($2.8 billion beat).
🔎 Advertising: $81.6 billion (+14%).
Search: $63.3 billion (+17%).
YouTube ads: $11.1 billion (+13%).
Network: $7.3 billion (-1%).
📱 Subscriptions, platforms, and devices: $12.9 billion (+15%).
☁️ Cloud: $24.8 billion (+82%).
Margin trends:
Gross margin: 62% (+2pp Y/Y).
Operating margin: 34% (+2pp Y/Y).
Services (Advertising & Other): 42% (+2pp Y/Y).
Cloud: 36% (+15pp Y/Y).
Operating cash flow was $39.1 billion (+39% Y/Y).
Free cash flow flipped negative to a $5.9 billion outflow (compared to $24.5 billion generated last year).
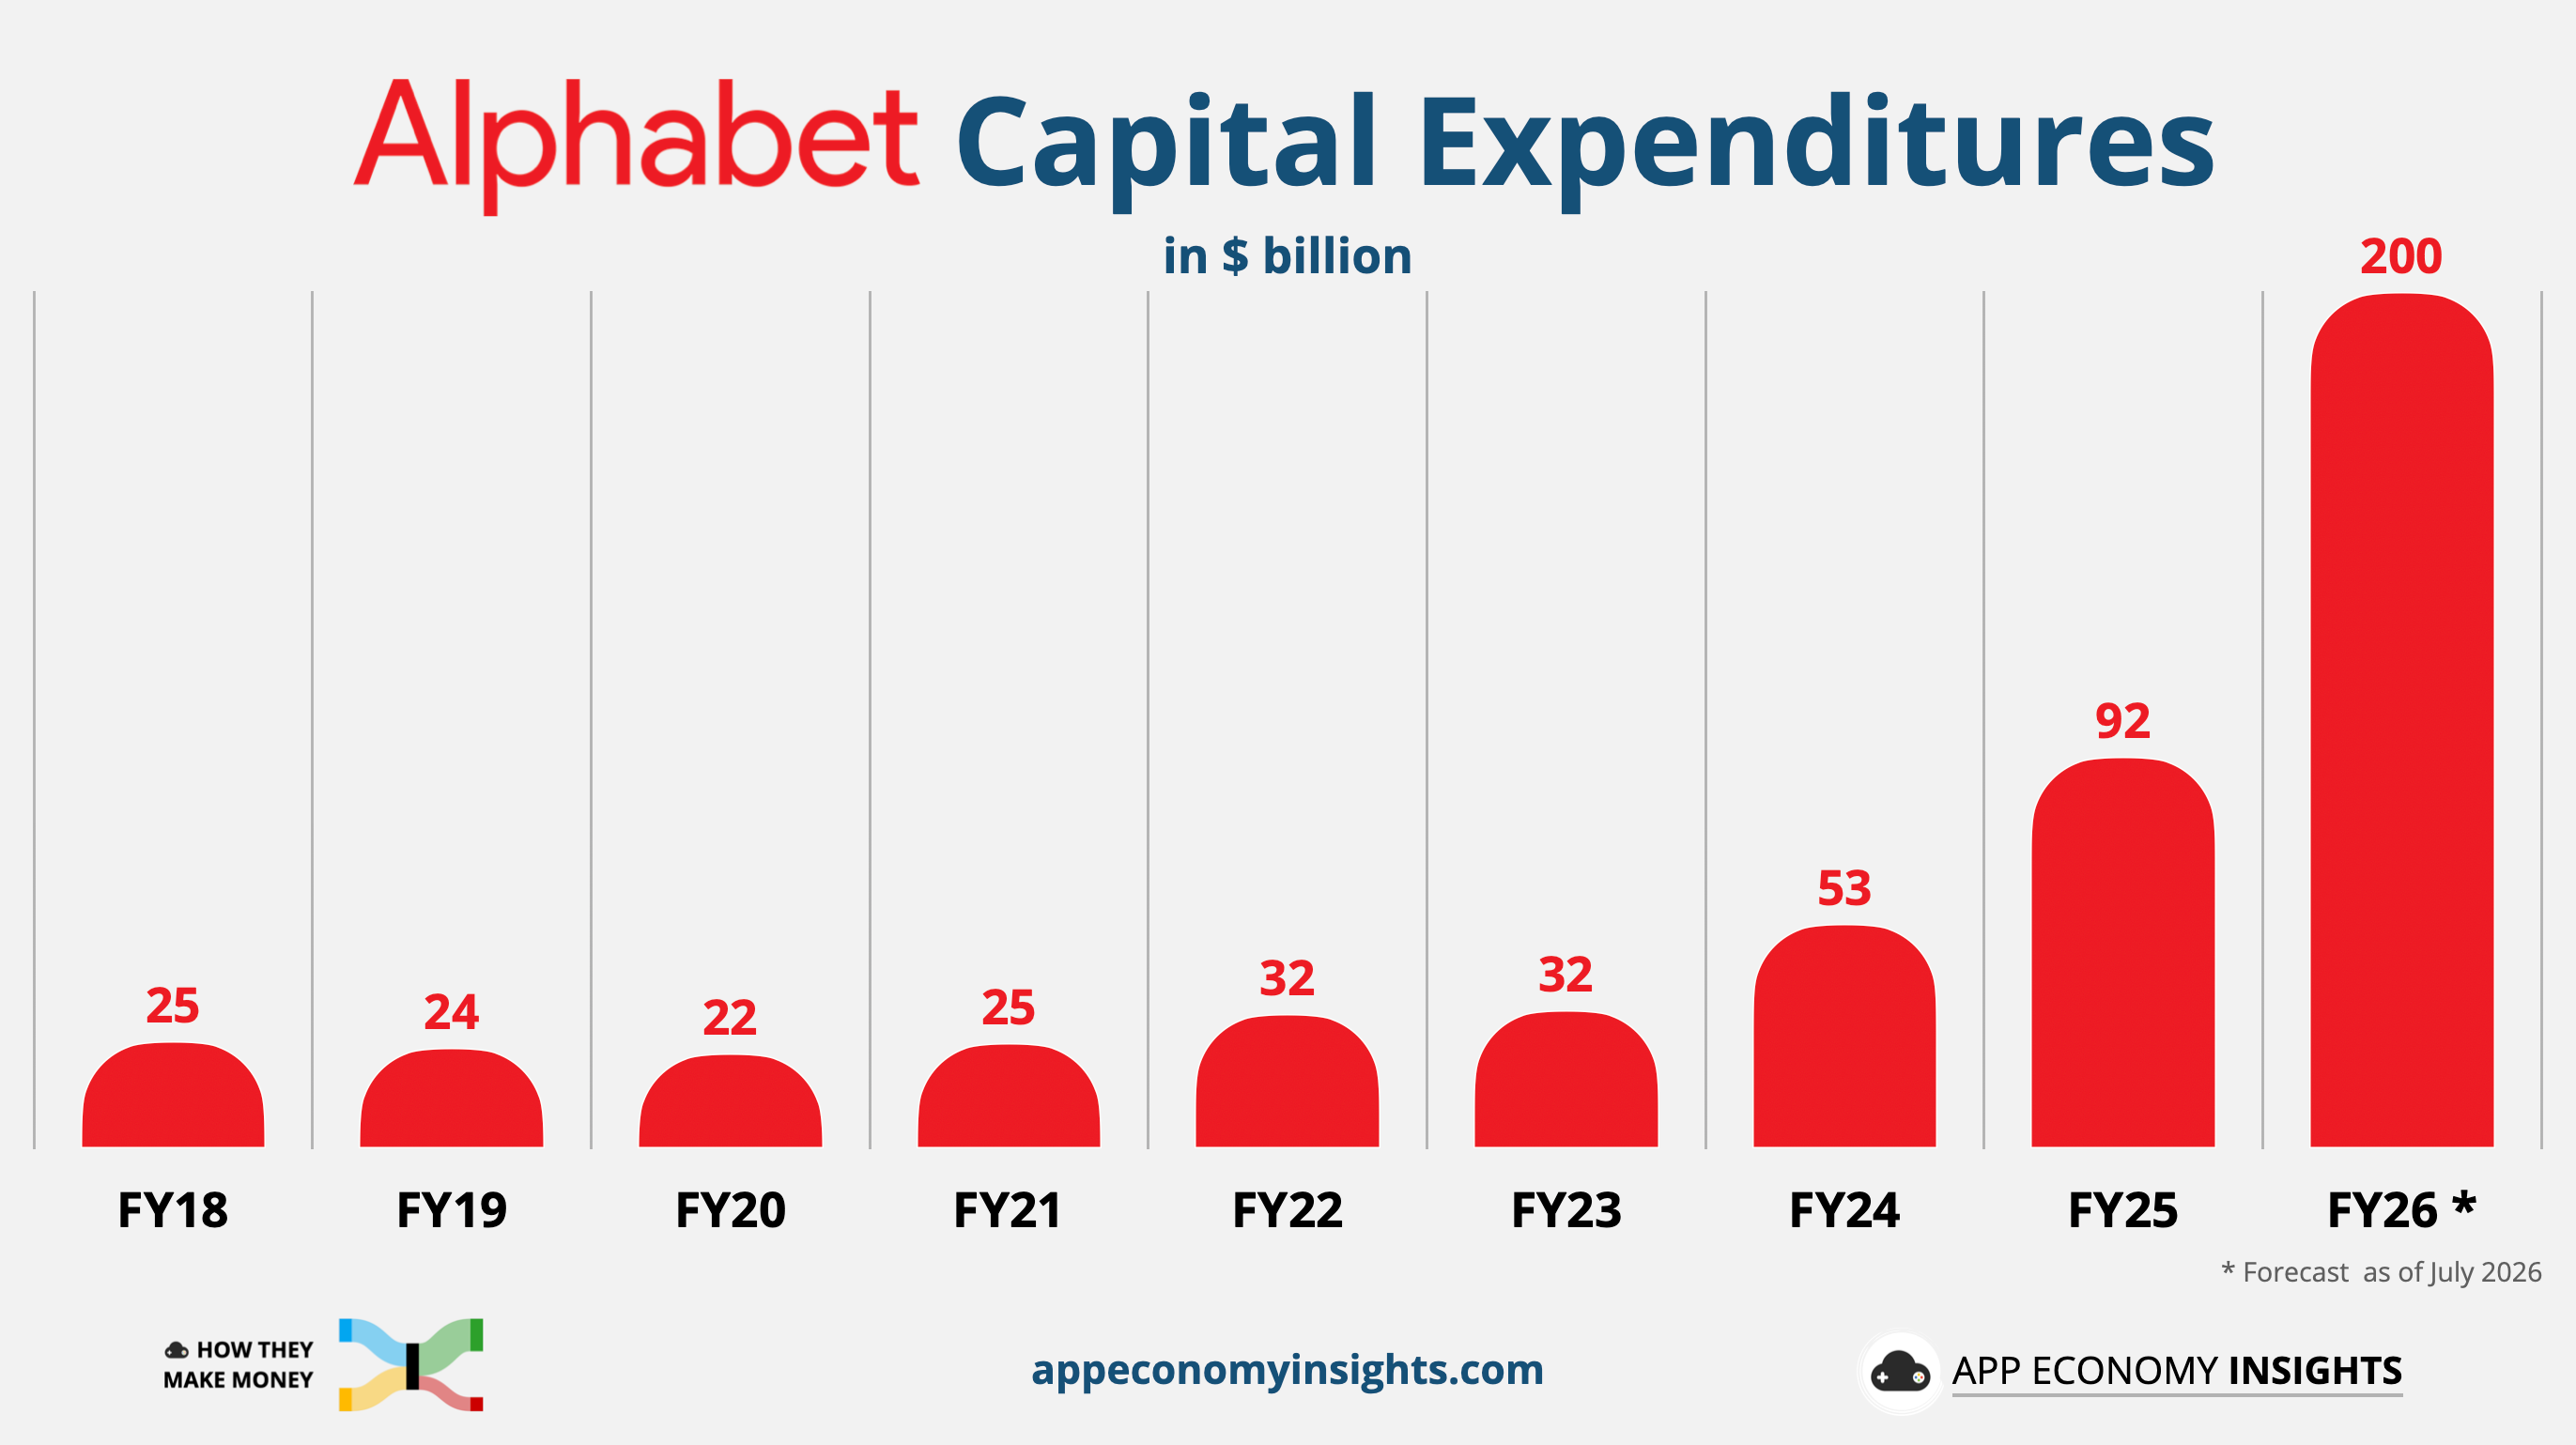
With CapEx now expected to reach ~$200 billion in FY26 (up from $185 billion previously), most of Alphabet's operating cash flow will be plowed back into AI spending.
Cash, cash equivalents, and marketable securities: $242.5 billion.
Long-term debt: $98.2 billion.
2026-07-18 22:00:13
Welcome to the Saturday PRO edition of How They Make Money.
Over 300,000 subscribers turn to us for business and investment insights.
In case you missed it:
📊 Monthly reports: 200+ companies visualized.
📩 Tuesday articles: Exclusive deep dives and insights.
📚 Access to our archive: Hundreds of business breakdowns.
📩 Saturday PRO reports: Timely insights on the latest earnings.
Today at a glance:
⚡️ TSMC: AI Megatrend Deepens
🔬 ASML: Second Guidance Hike
💊 J&J: Oncology & Icotyde Deliver
💼 UnitedHealth: Turnaround Print
👔 Morgan Stanley: $10 Trillion Milestone
🏛️ Goldman Sachs: SpaceX Leads Deal Run
📈 BlackRock: Assets Cross $15 Trillion
🧬 Abbott: Diagnostics Carry The Quarter
🦾 Intuitive Surgical: Growth Deceleration
🛩️ United Airlines: Premium Absorbs Fuel Spike
TSMC’s Q2 revenue rose 34% Y/Y to $40.2 billion ($900 million beat), while EPS per ADR surged 74% Y/Y to $4.31 ($0.37 beat). Gross margin expanded to a stunning 68%, operating margin hit 60%, and net profit margin reached 56%. It was the fifth straight quarter of record earnings. After a near-40% run this year, the stock is priced for blowouts, and even this one triggered classic “sell-the-news” profit-taking.
CEO C.C. Wei maintained his bullish tone, saying that “our conviction in the multi-year AI megatrend remains very high.” Advanced nodes (7nm and below) now generate 77% of wafer revenue (up 3pp Q/Q), with 3nm at 30% and 2nm debuting at 3% ahead of a steep ramp in the back half. Management flagged agentic AI as a new demand driver, reviving CPU orders in data centers alongside accelerators. Mature nodes (45/40nm, 28nm, 16nm) all declined sequentially, an early sign that higher memory prices may be pinching mainstream semiconductor demand.
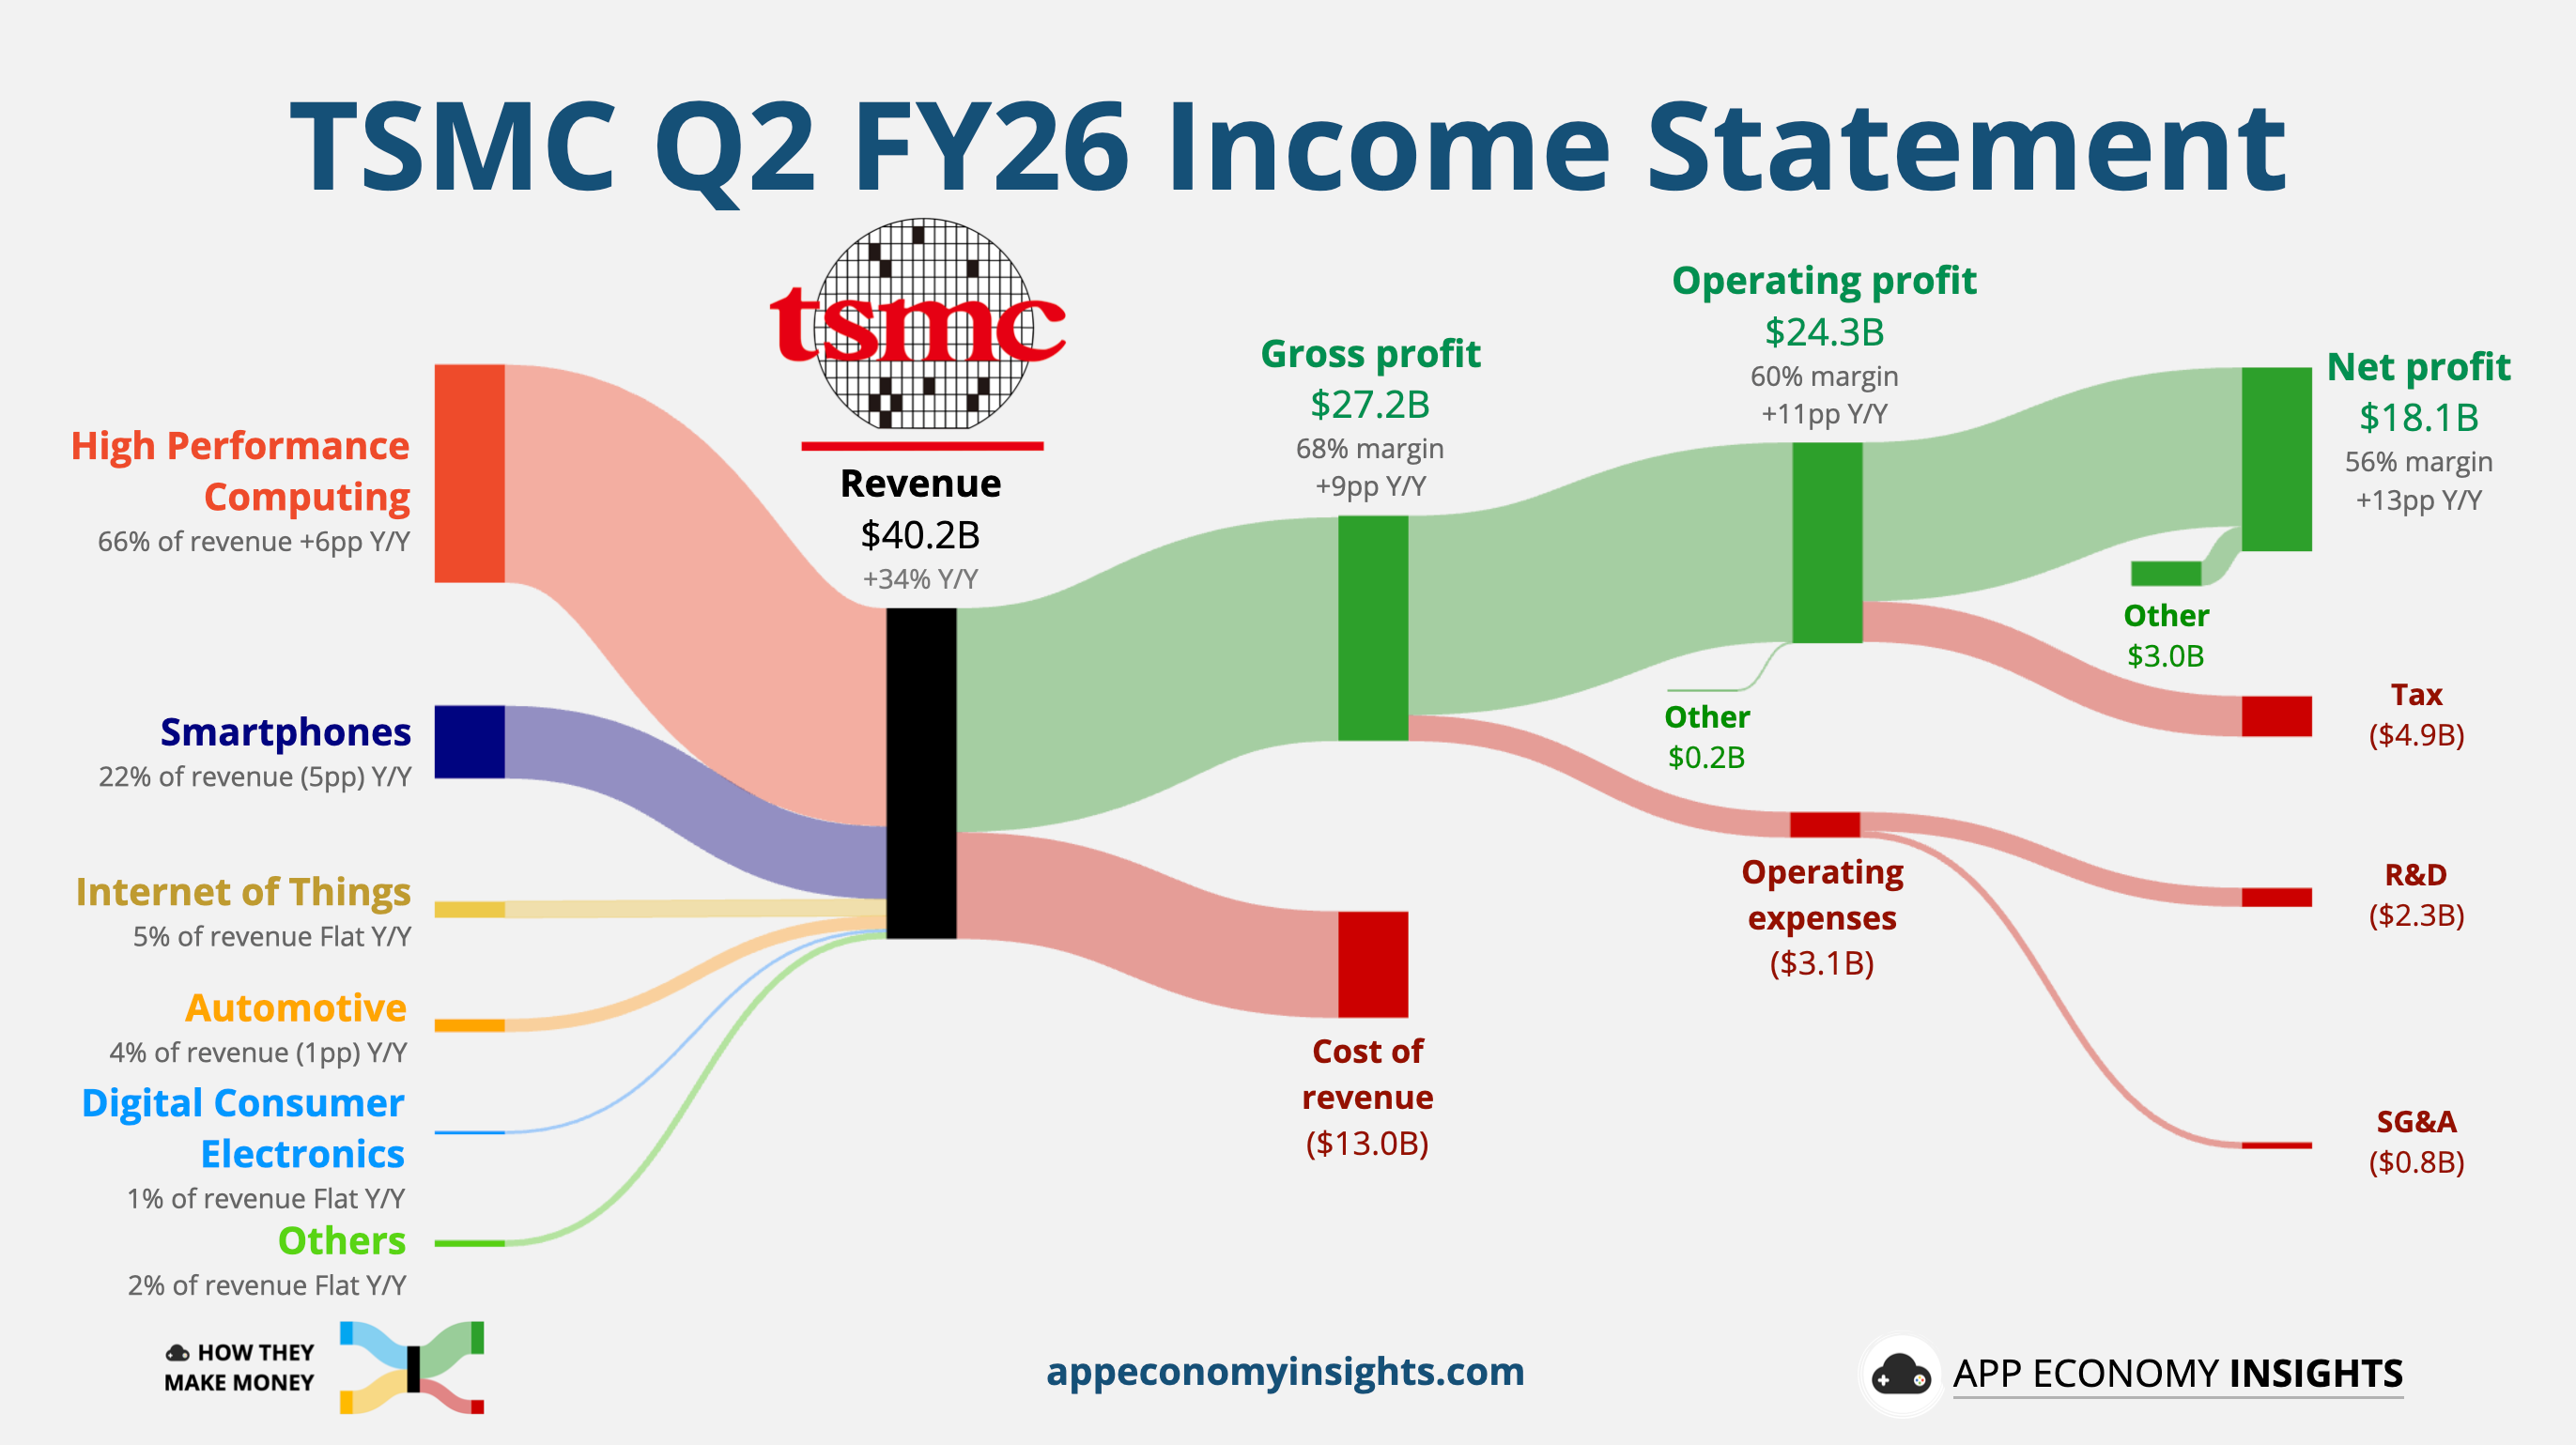
The two big strategic announcements were another $100 billion US investment and a massive CapEx raise:
Total US commitment now reaches $265 billion, funding 12 leading-edge and packaging facilities in Arizona.
FY26 CapEx was raised to $60–$64 billion (from $52–$56 billion).
CFO Wendell Huang said CapEx over the next three years will be “significantly higher” than the past three, with 70–80% of the 2026 budget going to advanced nodes.
TSMC raised FY26 revenue growth guidance to slightly above 40% in USD (vs. ~35% consensus), up from >30% prior. It was the second hike this year. Asked about Samsung and Intel, Wei was dismissive. He explained that foundry partnerships aren't like "buying milk from the 7-11," and customers locked in for years won't switch on price.
The real risk for TSMC is cost. Overseas fab ramps and the 2nm expansion will temporarily weigh on gross margin, just as CapEx surges. Watch whether gross margin can hold near 67% in Q3 while record spending and the steepest phase of the 2nm ramp hit the P&L simultaneously. The widening of capital intensity could start to compress industry-leading margins even as the AI demand cycle extends into 2028.
ASML's Q2 revenue rose 21% Y/Y to €9.3 billion (€400 million beat), with GAAP EPS up 29% Y/Y to €7.59 (€0.60 beat). Gross margin came in at 54%, above guidance, on high-margin Installed Base Management sales. Free cash flow reached €1.3 billion, and ASML repurchased €1.1 billion of shares. Shares are up nearly 70% YTD.
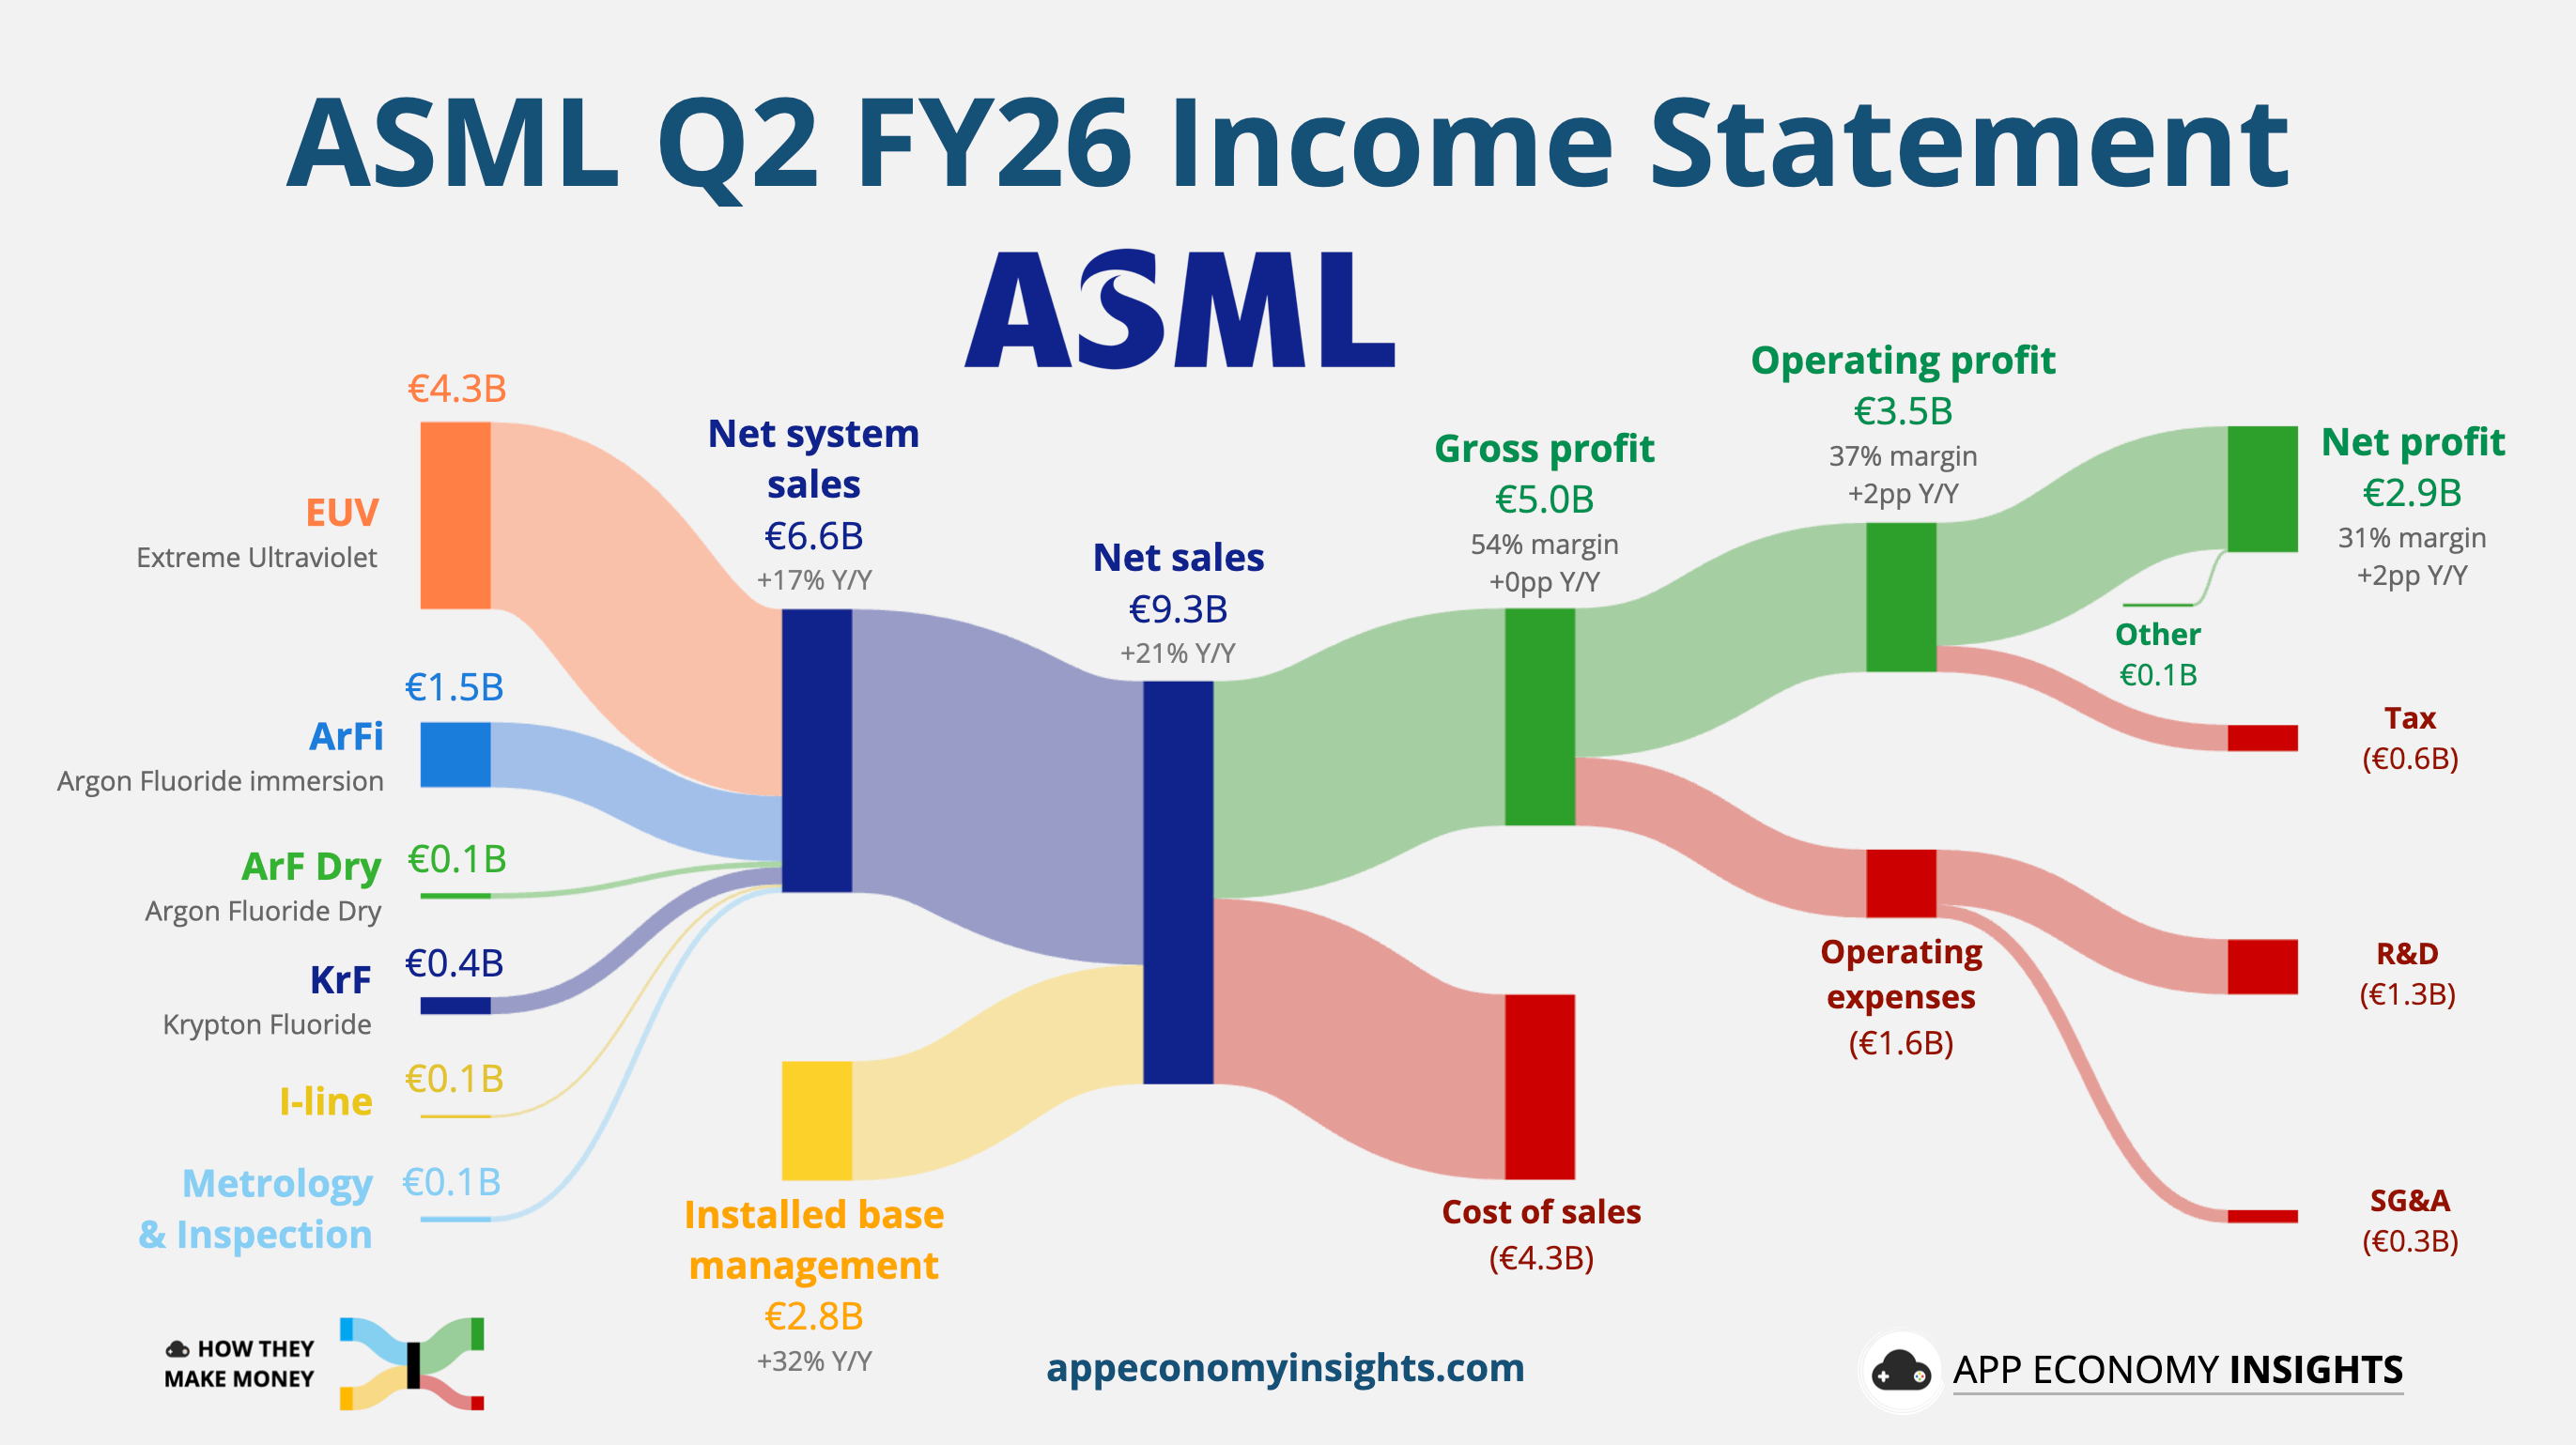
The big news was the second guidance raise of the year, along with concrete multi-year capacity plans:
FY26 revenue guidance was lifted to €43–€45 billion (from €36–€40 billion, and vs. €39 billion consensus).
FY26 gross margin was raised to 54–56% (from 51–53%).
Q3 revenue is now €11–€12 billion (vs. €10.4 billion consensus).
Low-NA EUV capacity is projected to grow ~30% in 2027 to ~85 units, with another ~30% increase in 2028 (~110 units).
DUV immersion capacity is also expanding 30% in each of the next two years.
The AI infrastructure buildout has been a flywheel for ASML. Advanced logic revenue is expected to grow ~25% this year and memory ~75%, with customers “aggressively adding capacity” across 5nm, 4nm, 3nm, and 2nm nodes and already planning for 1.4nm.
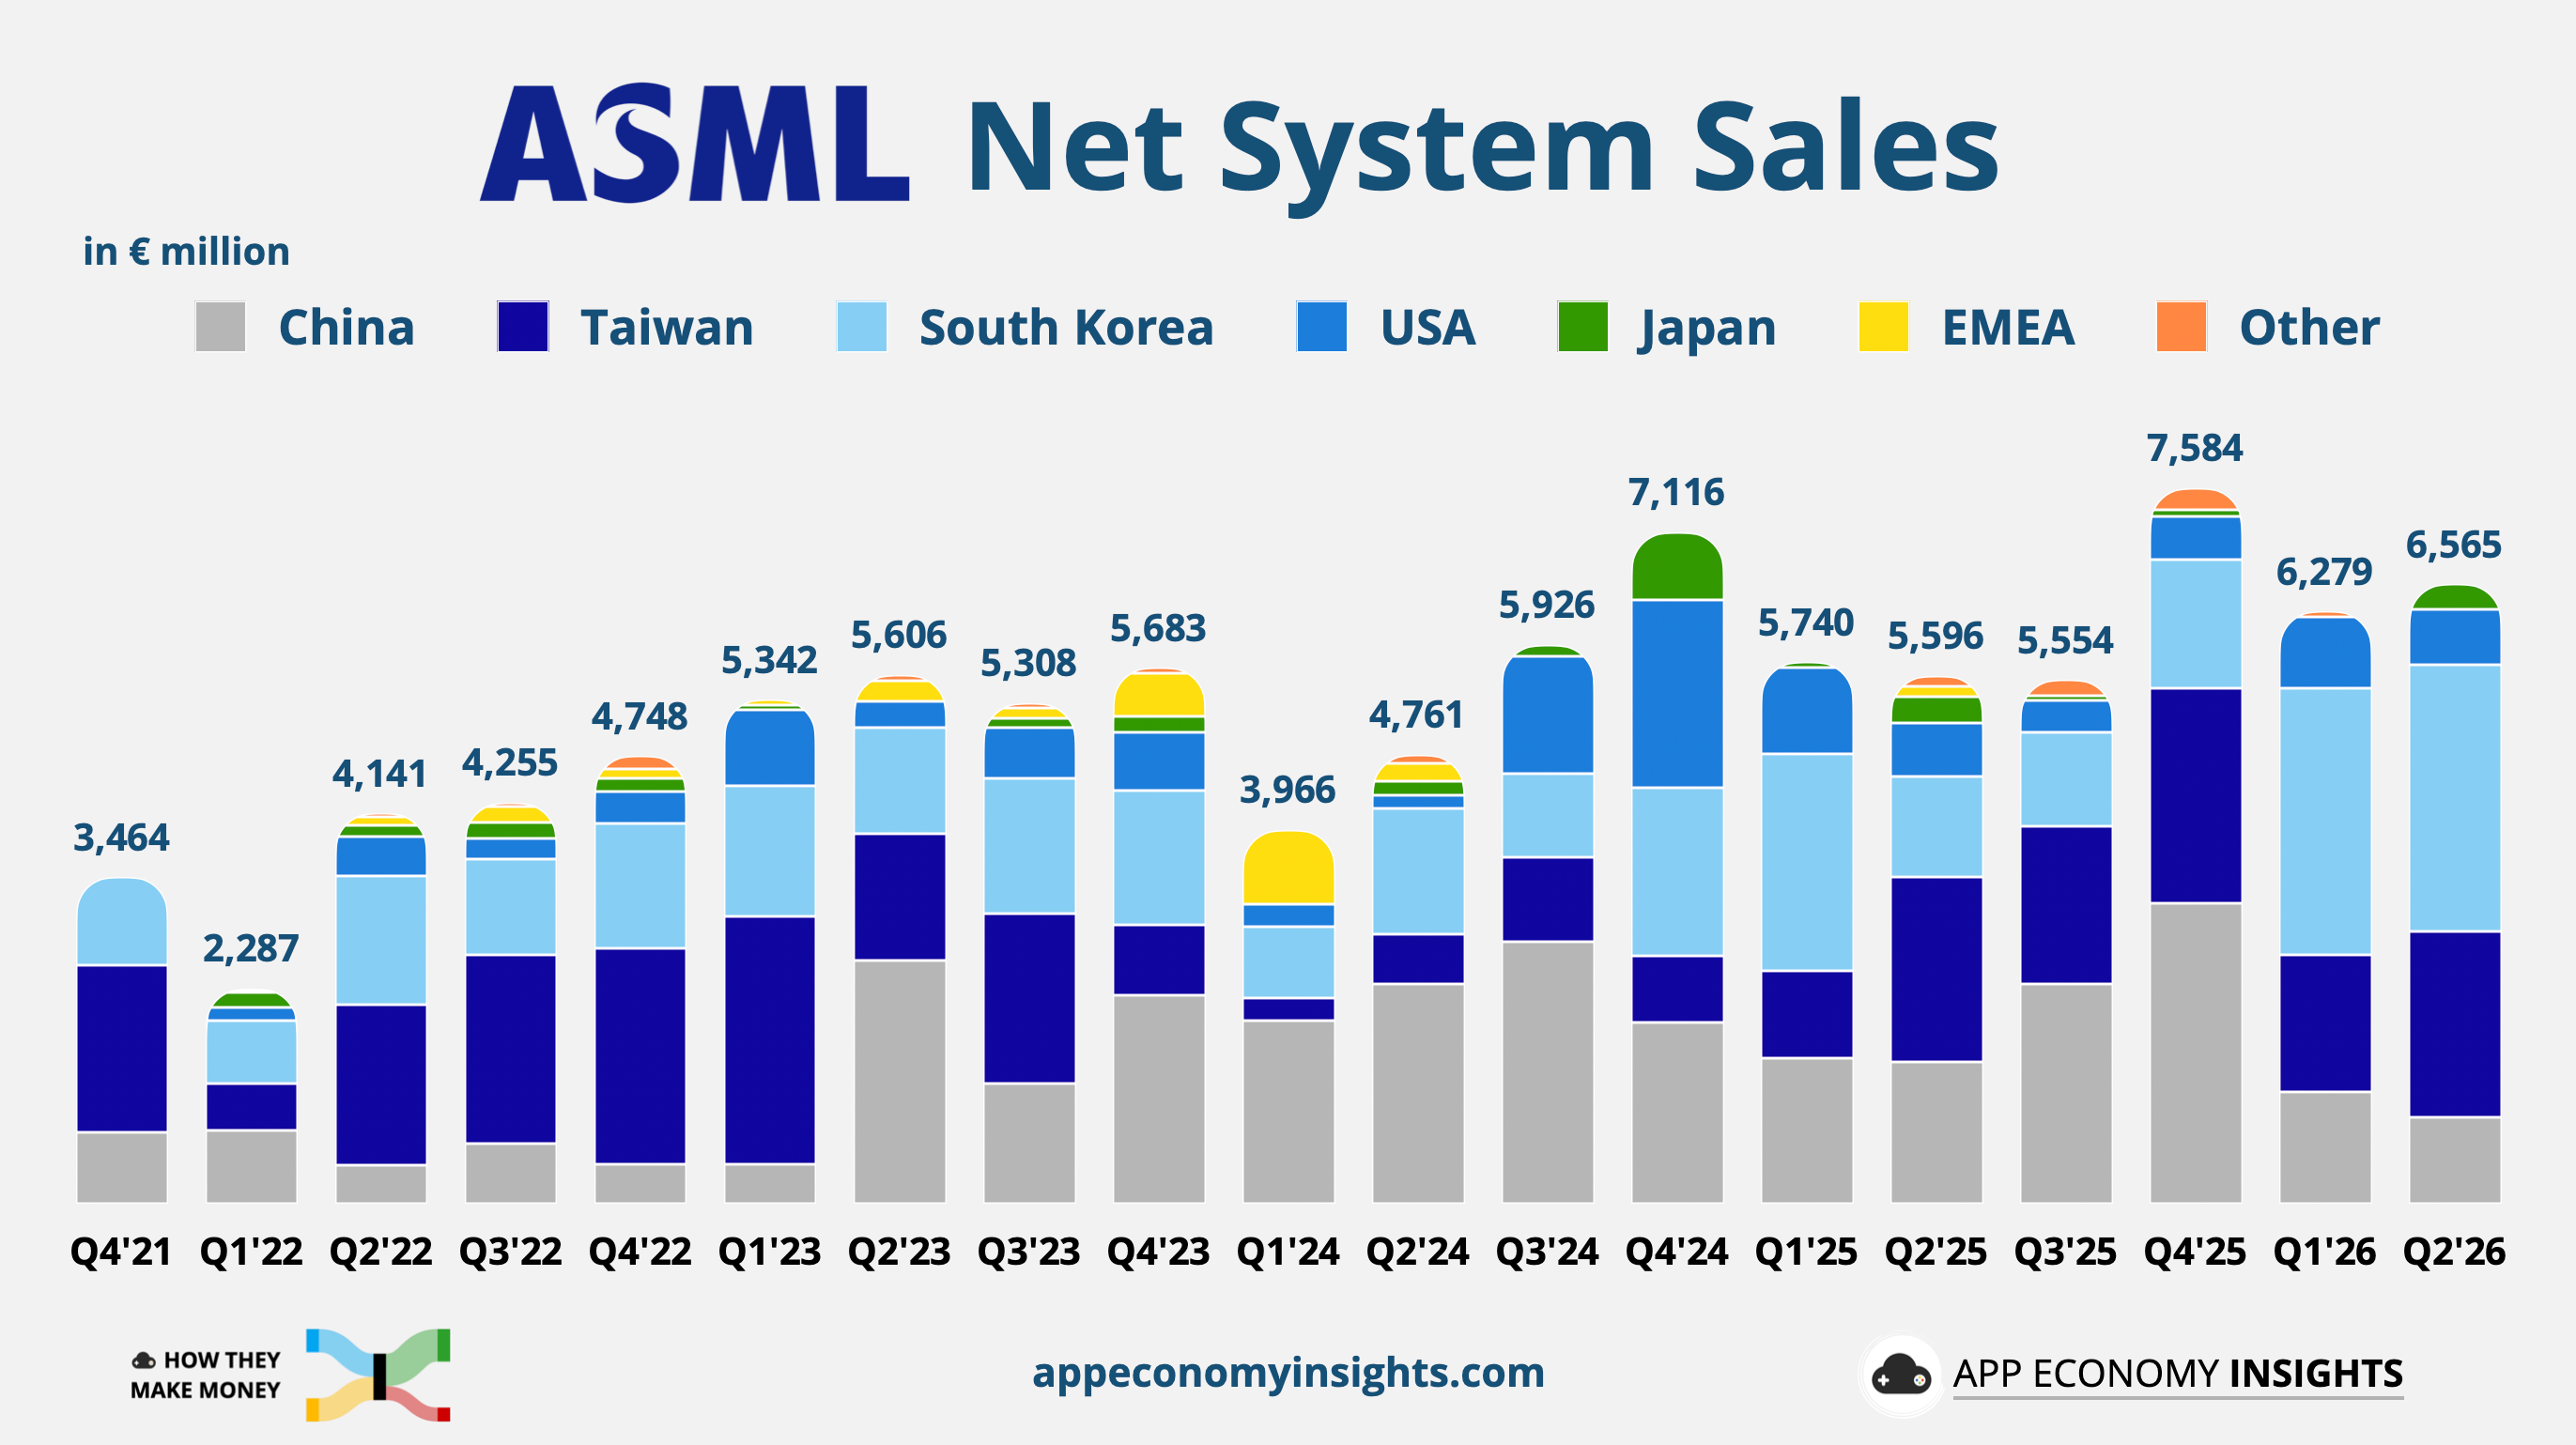
Intel Foundry began production on the Intel 18A node using ASML’s most advanced High-NA EUV tool. Meanwhile, TSMC has said it will hold off on High-NA through 2029. CFO Roger Dassen also flagged potential pricing power on Low-NA tools given “current environment” dynamics. It was a nod to the reported pricing dispute with TSMC. China’s share of system sales dropped further to 14% (from 19% in Q1), tracking below the ~20% full-year target.
ASML confirmed its Capital Markets Day for June 10, 2027, when it will update long-term outlook. The next question is whether the pricing conversations with customers translate into meaningful ASP gains in 2027, or whether TSMC's pushback caps how much of the AI demand tailwind flows through to ASML's margin structure.
2026-07-17 20:03:08
Welcome to the Free edition of How They Make Money.
Over 300,000 subscribers turn to us for business and investment insights.
In case you missed it:
Netflix no longer needs to prove that streaming can be profitable. It needs to prove that a mature streaming business can continue to grow. The market has expressed skepticism, with shares down more than 40% in the past year. The Q2 FY26 print offered no relief, with the stock falling roughly 8% after hours.

The company walked away from Warner Bros. Discovery last quarter, avoiding an expensive bidding war and collecting a $2.8 billion breakup fee. But the decision also removed a potential shortcut to the next phase of growth. Netflix must now generate it internally through higher prices, advertising, live programming, and a wider variety of content.
That task is becoming more urgent as competition for attention intensifies. YouTube continues to gain television share, free services like Tubi are growing, and traditional media companies are using sports to pull audiences into their platforms. Netflix’s response is to give viewers more reasons to open the app without weakening the economics that made the business so attractive.
Today at a glance:
🍿 Netflix Q2 FY26
📺 Becoming the bundle
📈 The battle for attention
💳 Stripe wants to buy PayPal

Revenue +13% Y/Y to $12.6 billion ($20 million miss).
Operating margin 33% (-1pp Y/Y).
EPS +11% Y/Y to $0.80 ($0.01 beat).
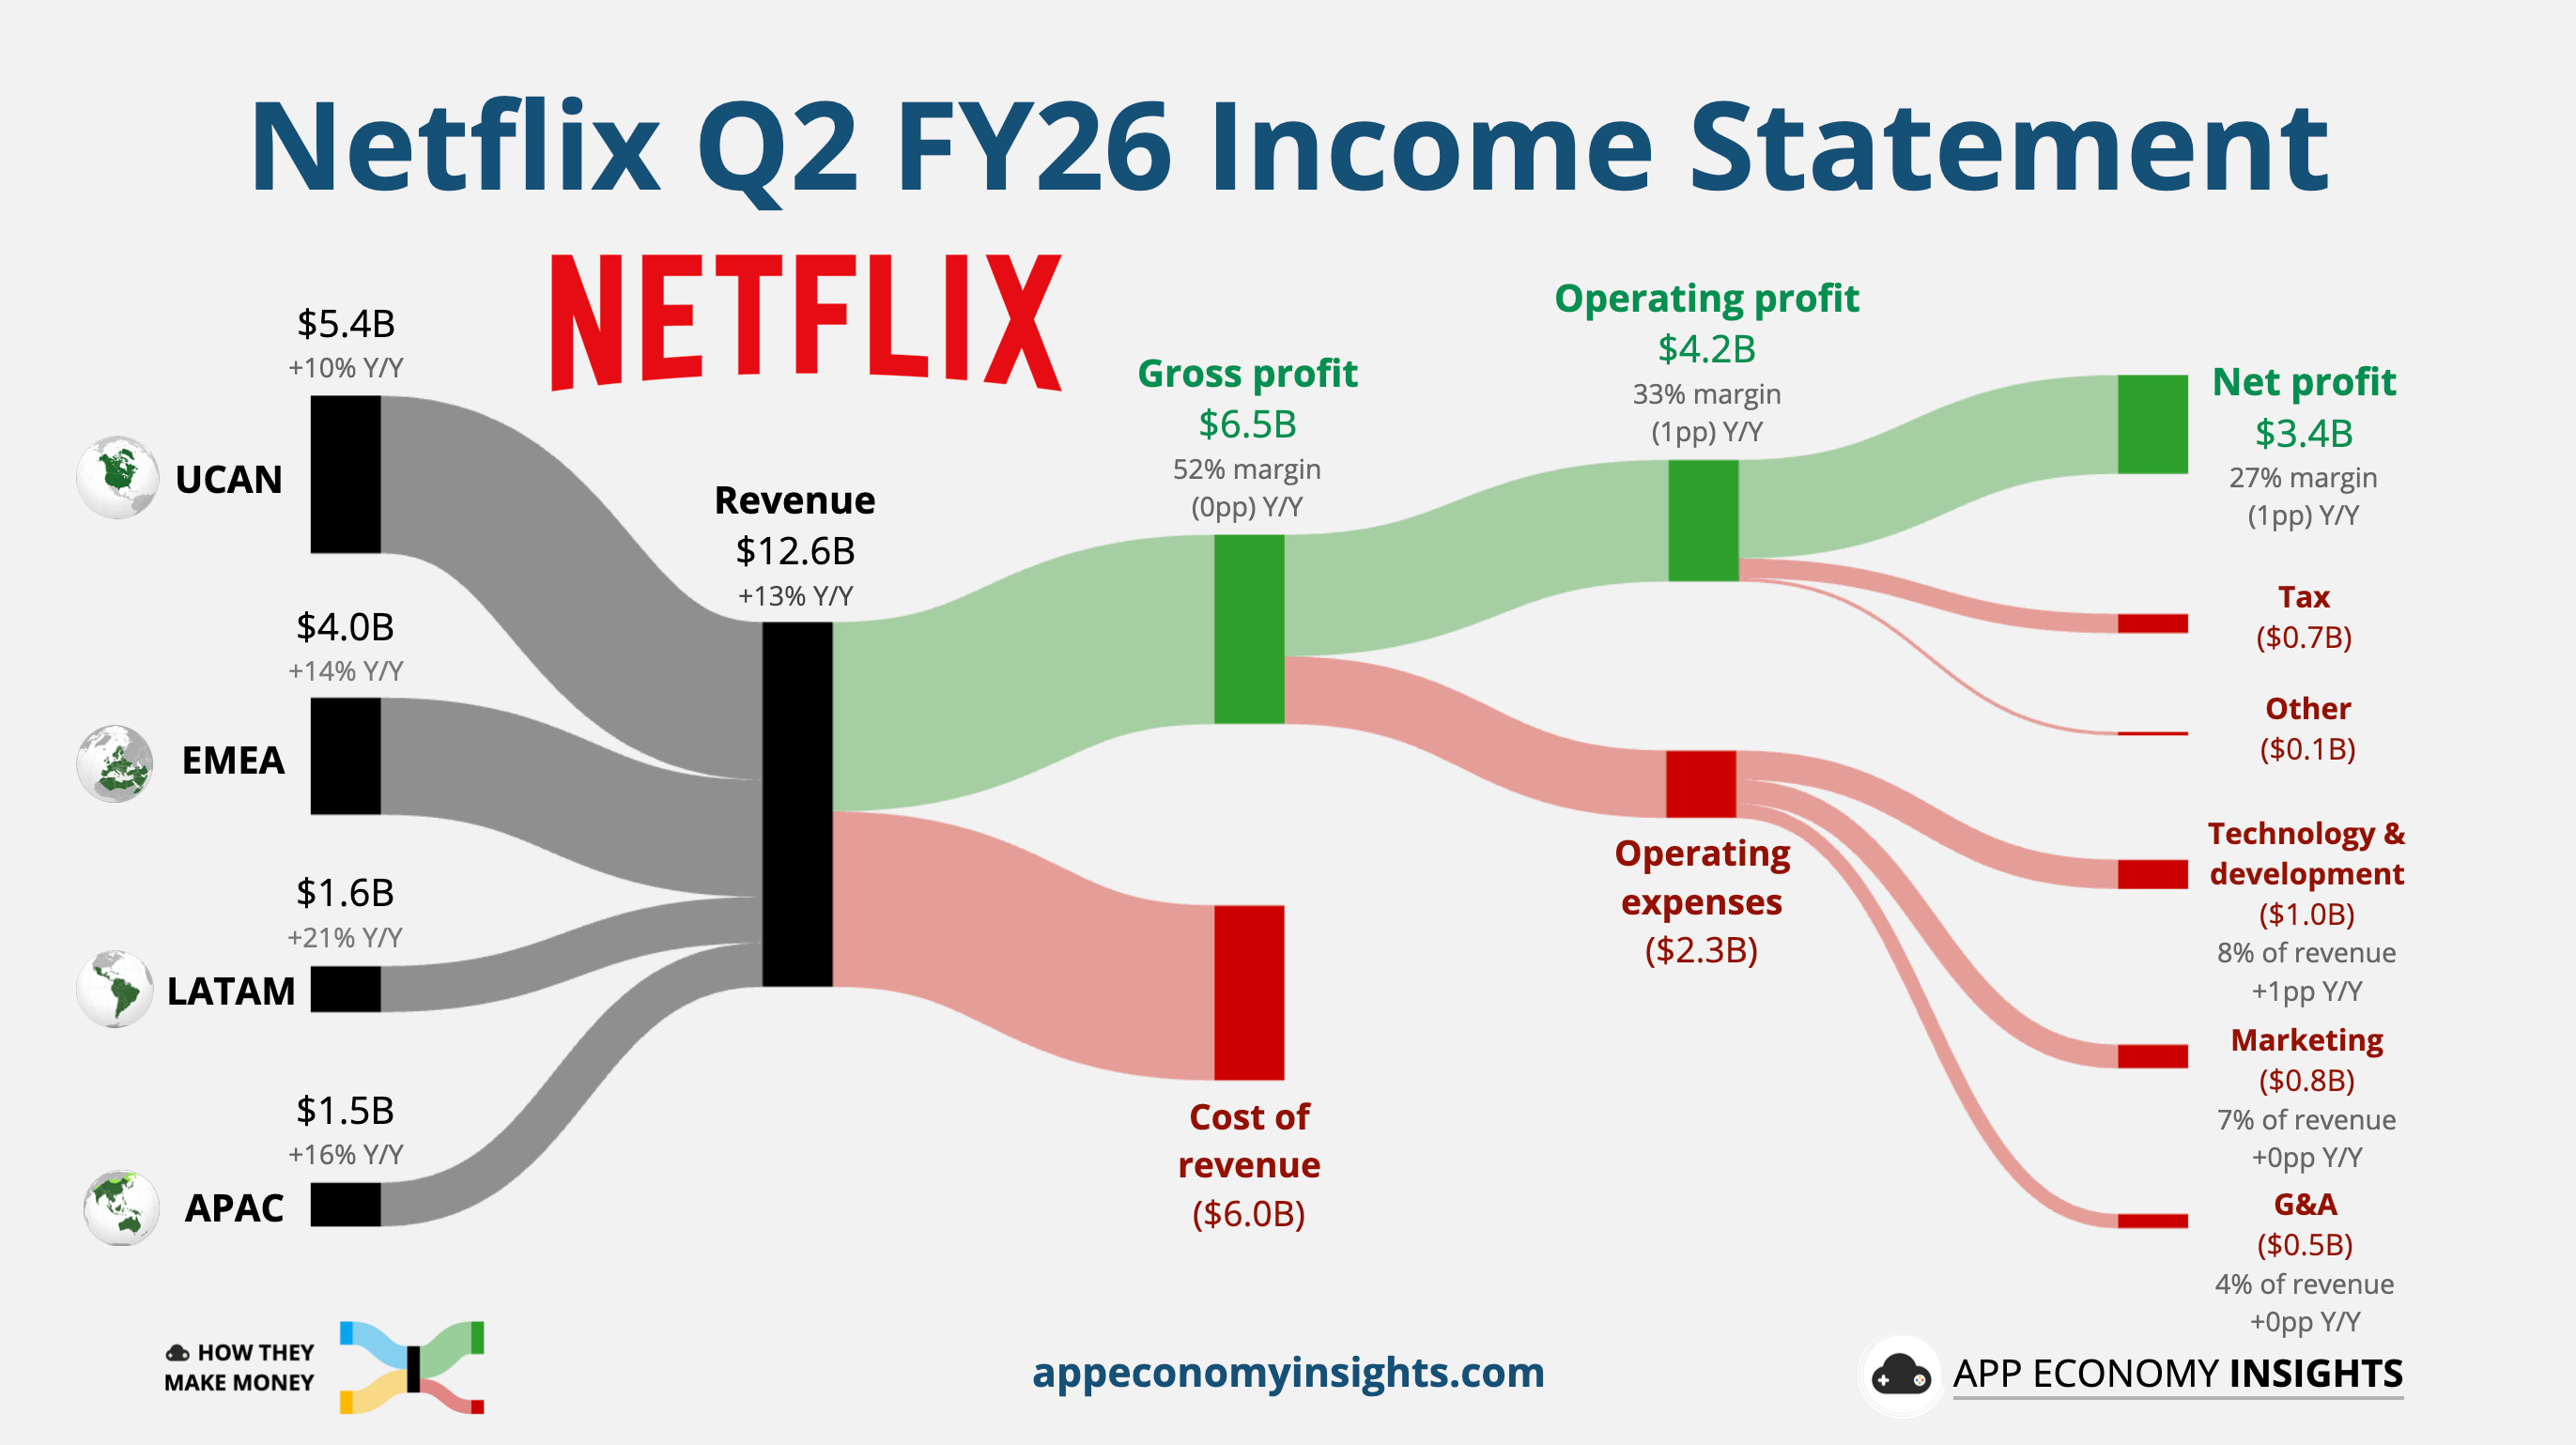
Cash and short-term investments: $9.1 billion.
Debt: $14.4 billion.
Revenue +13%-14% to ~$51.2 billion with a narrower range.
Operating margin 31.5% (+2pp Y/Y, unchanged from last quarter).
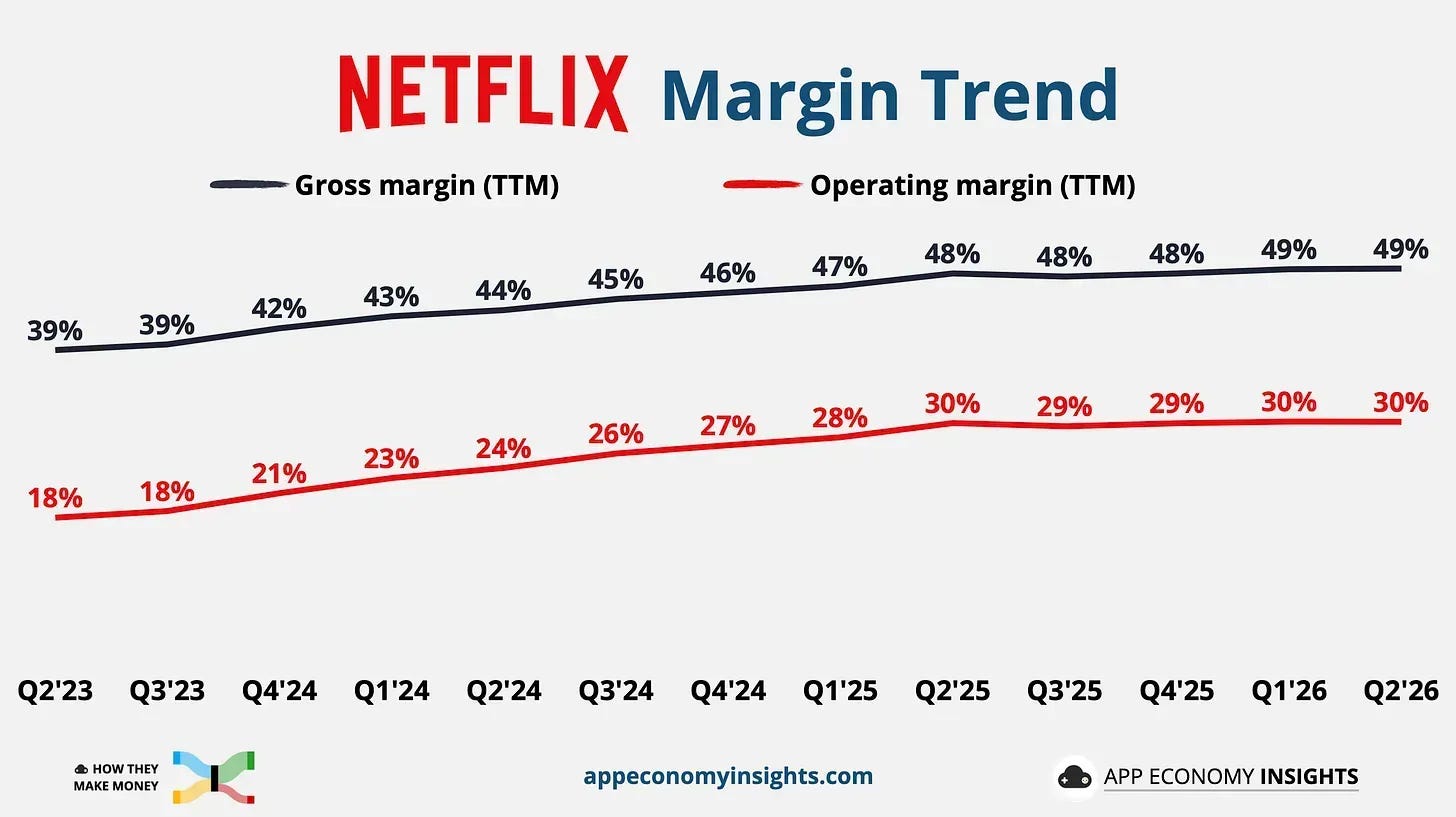
📊 Solid, but no raise: The numbers came mostly in line with consensus. The operating margin exceeded Netflix’s own forecast, but the full-year outlook was only narrowed to the same midpoint. The slight Y/Y margin compression reflected front-loaded content amortization, with expansion set to resume in the second half. Management expects Q3 operating margin of 33%, up from 28% a year ago. In a world where outlooks are meant to be beaten and raised, it wasn’t quite what Wall Street was hoping for. The expected 12% Q3 revenue growth would be the slowest since 2023.
📢 Ads doubling on schedule: Netflix reiterated its expectation for roughly $3 billion in 2026 ad revenue, with US upfront commitments expected to close within weeks. Programmatic access is expanding to Pause Ads and live inventory this summer, reducing the manual friction that kept smaller advertisers out. How far the business scales will depend heavily on how automated it can become.
📺 Live punches above its weight: Members watched 97 billion hours in H1, up 2% Y/Y and accelerating from 1.5% growth in 2025. Live programming will consume just over 5% of 2026 content spending and drive only about 1% of view hours, yet it accounts for six of Netflix’s 10 largest new-member sign-up days over the past five years. With the NFL and Fury-Joshua, Netflix is buying sign-ups more than hours.
🤖 GenAI at scale: GenAI workflows touched ~300 titles in 2026, concentrated in post-production. Management framed it as shots and sequences that otherwise wouldn’t exist (enhanced crowds, historical battles, worldbuilding), delivered faster and cheaper than traditional methods. Netflix framed the technology as a capability expansion rather than a cost-cutting exercise.
💰 Record buybacks: Netflix repurchased $4.7 billion of stock, its largest quarter ever, with $27.1 billion of capacity remaining after April’s fresh $25 billion authorization. Free cash flow fell to $1.5 billion from $2.3 billion, but the drag was largely cash taxes tied to the Warner Bros. termination fee. The full-year ~$12.5 billion FCF target is unchanged.
📉 Retiring the engagement scoreboard: The What We Watched report moves from biannual to annual starting in 2027, deliberately decoupled from earnings. Management wants the quarterly conversation anchored on revenue and operating profit, not view hours. It’s the same signal as removing subscriber counts. Netflix wants to be judged as a scaled compounder, and it is steadily removing the metrics that invite a different debate. The change is more controversial because management has repeatedly presented engagement as its North Star. Reducing disclosure makes it harder to independently judge what is driving performance. Subscriber churn also remains undisclosed, an unusual omission for a subscription business.
Netflix spent years replacing scheduled television with an ad-free, on-demand library. Now it is selectively rebuilding many of the features it disrupted.
As of its last disclosure in May, the ad tier reached more than 250 million monthly active viewers, up from 190 million in November. Netflix expects advertising revenue to approximately double to around $3 billion this year, but audience growth alone is not enough. The next challenge is converting that reach into better targeting, higher fill rates, and more revenue per viewer.
That helps explain Netflix’s selective push into live sports. The company is not trying to replicate ESPN or Prime Video with full-season packages. Instead, it is focusing on tentpole events that attract large audiences, generate premium advertising inventory, and feel culturally significant.
Its new MLB deal includes Opening Night, the Home Run Derby, and the Field of Dreams game. Netflix will also carry five NFL games this season, including Thanksgiving Eve, Christmas Day, and a potentially decisive Week 18 matchup.
The approach creates appointment viewing without paying to fill hundreds of hours with lower-profile games. It may be a more capital-efficient way to use sports as an acquisition and advertising tool, although Netflix still has to prove audiences will follow isolated events to a platform that is not their year-round sports destination.
The strategy extends beyond sports. Netflix recently added TF1’s live channels and on-demand catalog directly to its service in France. Rather than acquiring a traditional media company, Netflix can integrate third-party programming and serve as the interface through which viewers access it..
The company is also expanding into video podcasts, short-form clips, and licensed videos from publishers. Together, these moves suggest Netflix wants to become more than the place viewers visit for a new season of Stranger Things. It wants to become an app they open every day.
That may increase engagement at a lower cost than premium scripted content. But it also creates strategic tension. Netflix is adding ads, scheduled programming, third-party channels, sports, podcasts, games, and vertical video. If those pieces do not feel cohesive, it risks recreating the bloated television bundle it once replaced.
Netflix’s engagement challenge is visible in Nielsen’s latest data. Streaming represented 47.6% of US TV time in April, up from 44.3% a year ago and near record levels, while cable fell from 24.5% to 21.6%.
Netflix captured 7.8% of US TV time in April, up slightly from 7.5% a year ago but below its 9.0% December peak, when Stranger Things and Christmas Day football lifted viewing. Monthly figures are heavily influenced by release schedules, but the broader competitive trend is harder to dismiss.
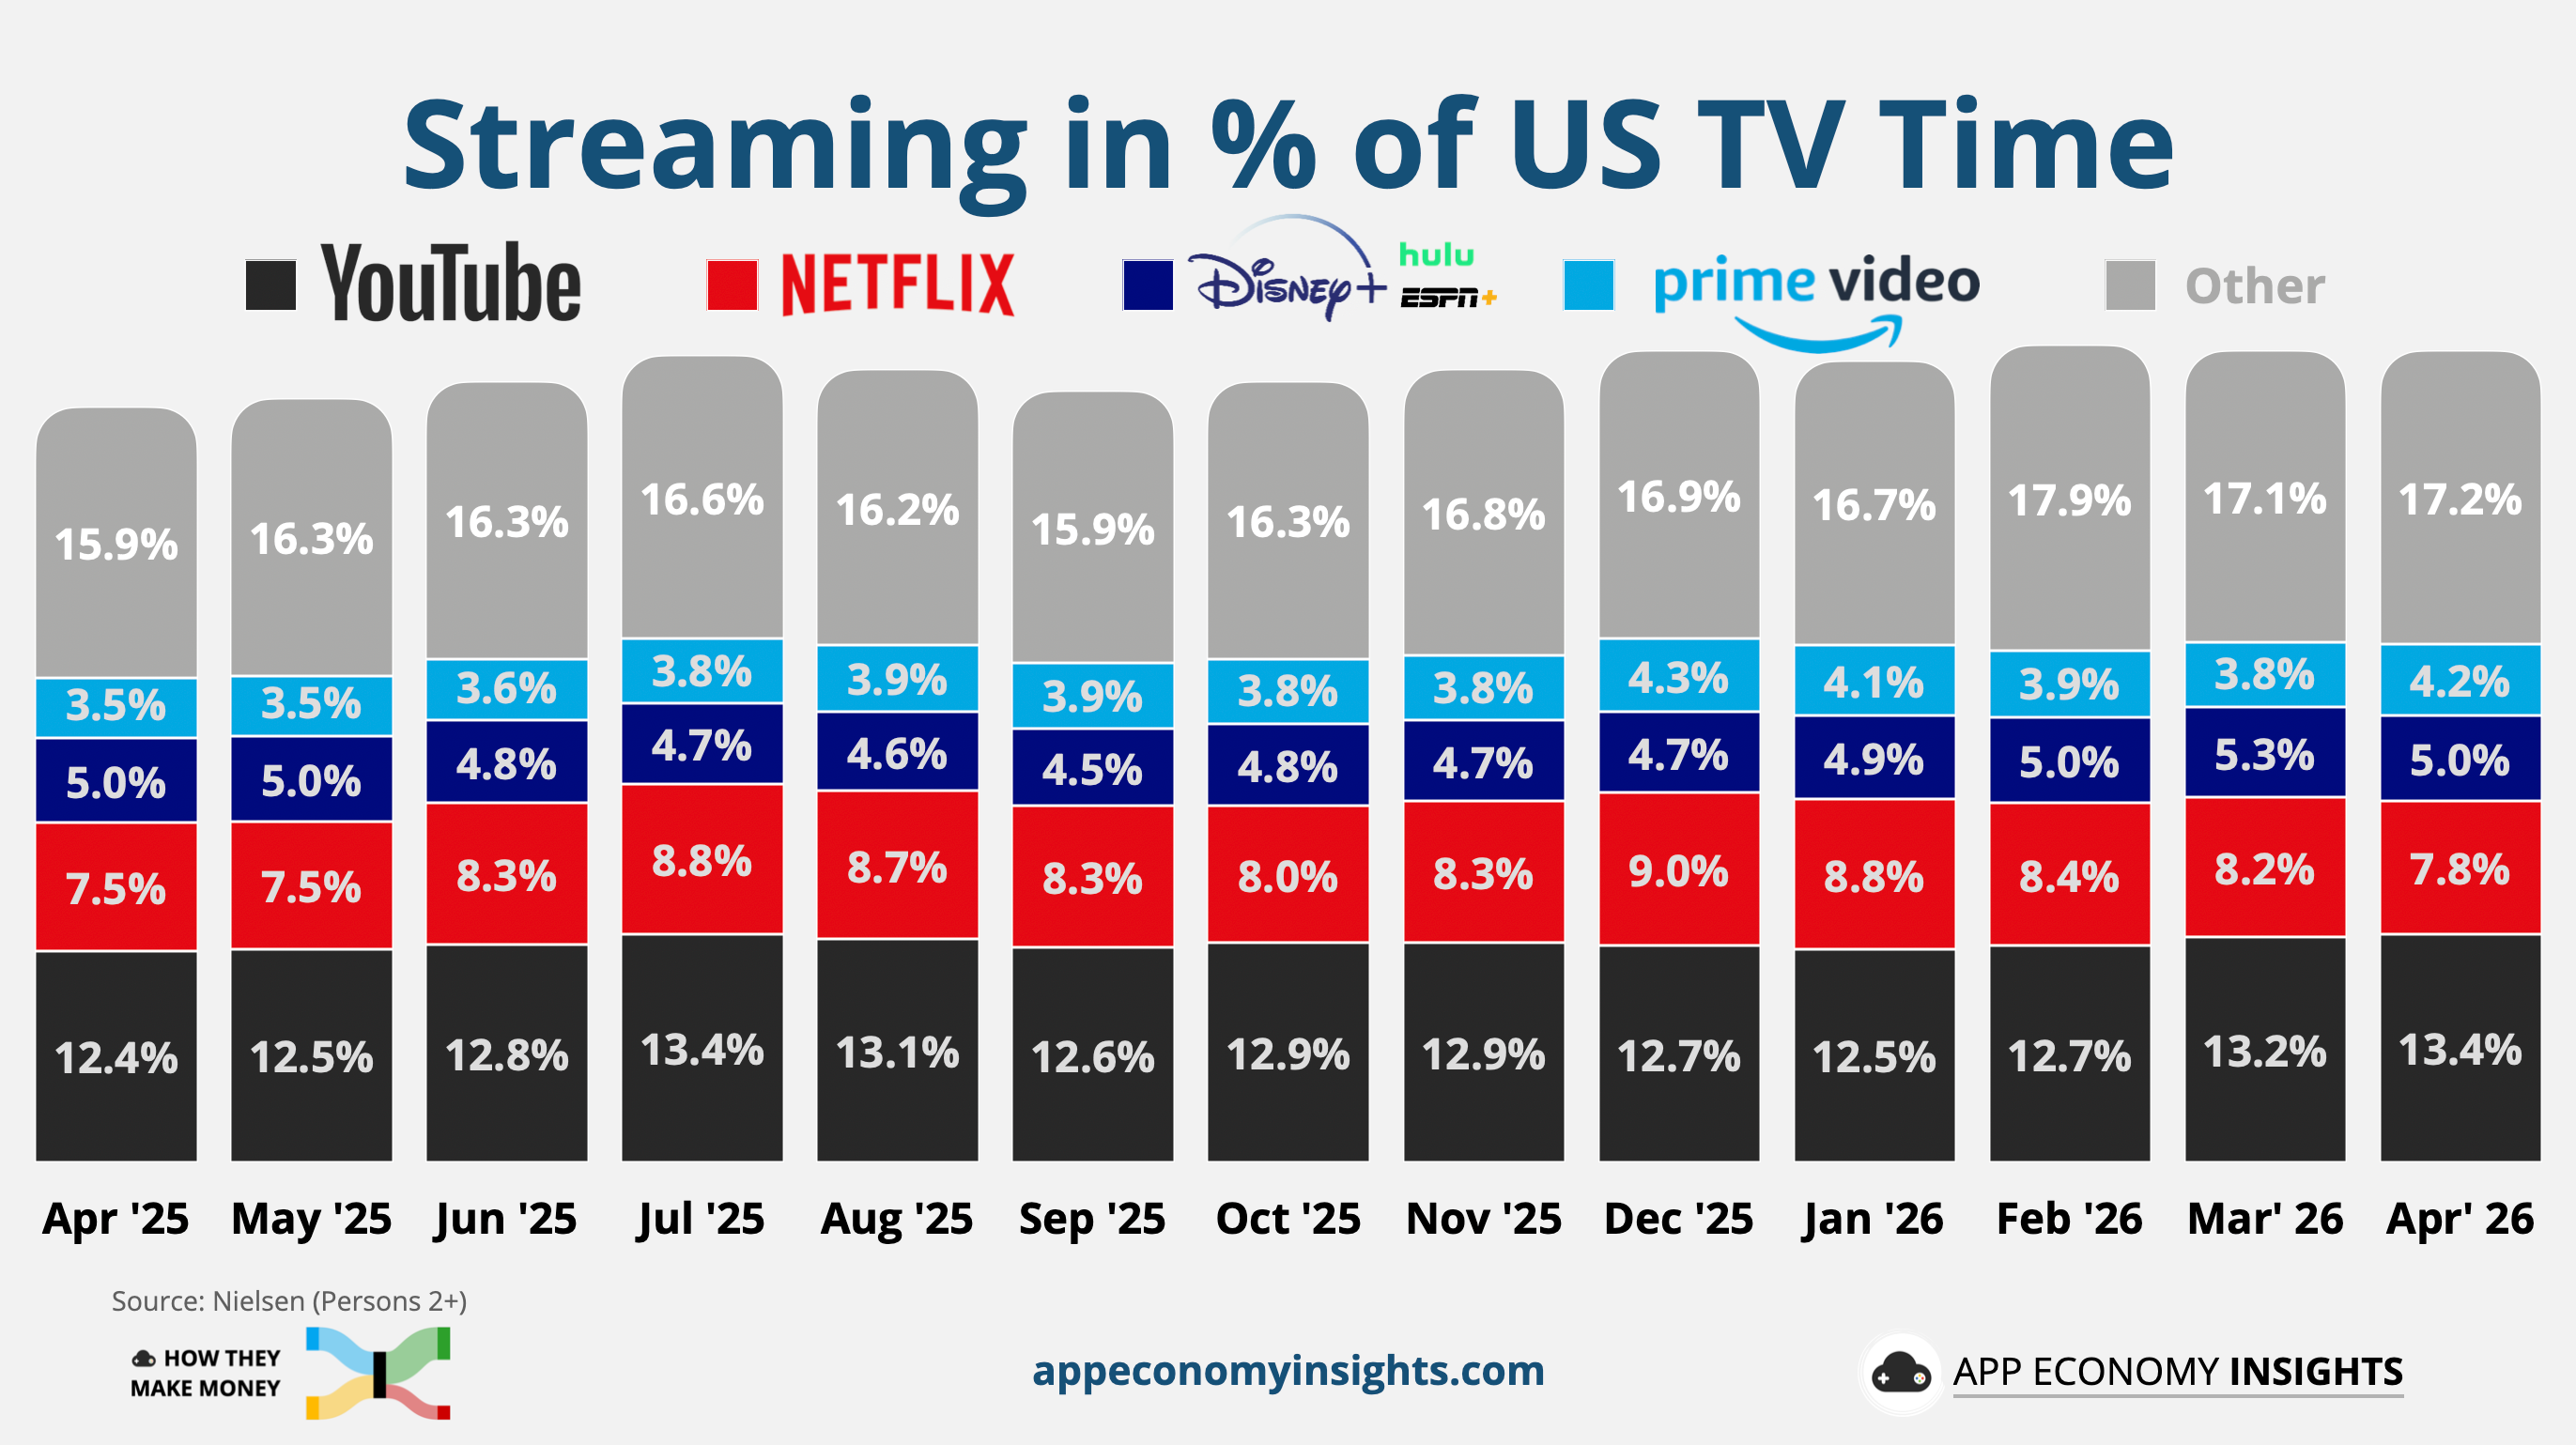
YouTube increased its share to a record 13.4% in April. Amazon Prime Video reached 4.2%, helped by its new NBA package, while Tubi hit a platform record of 2.3%. The competitors gaining the most attention are not relying exclusively on expensive scripted series. They combine creator content, sports, free programming, or multiple forms of entertainment.
Netflix argues that retention and customer satisfaction matter more than raw hours watched. That is reasonable for a subscription business. But engagement still supports nearly every part of its strategy. More viewing creates more advertising inventory, improves the return on content spending, reduces churn, and makes future price increases easier to absorb.
Bottom line: Netflix’s ad tier, pricing power, and operating leverage can support low double-digit growth. But at a premium valuation, investors need evidence that its broader entertainment strategy is producing more engagement, stronger monetization, and durable returns on spending. Otherwise, Netflix risks becoming more complex without becoming more valuable.
PayPal may be about to cash out. Reuters first reported that Stripe and private equity firm Advent International have offered $60.50 per share to acquire the company, valuing it at more than $53 billion. The proposal is reportedly backed by approximately $50 billion of committed financing.
This is still an unsolicited offer rather than an agreed deal. PayPal has not formally responded, and the companies involved have declined to comment. However, PayPal has reportedly been working with Goldman Sachs and Evercore to evaluate strategic options, including a potential sale or breakup. The company is not necessarily looking for a buyer, but it appears willing to consider what one might pay.
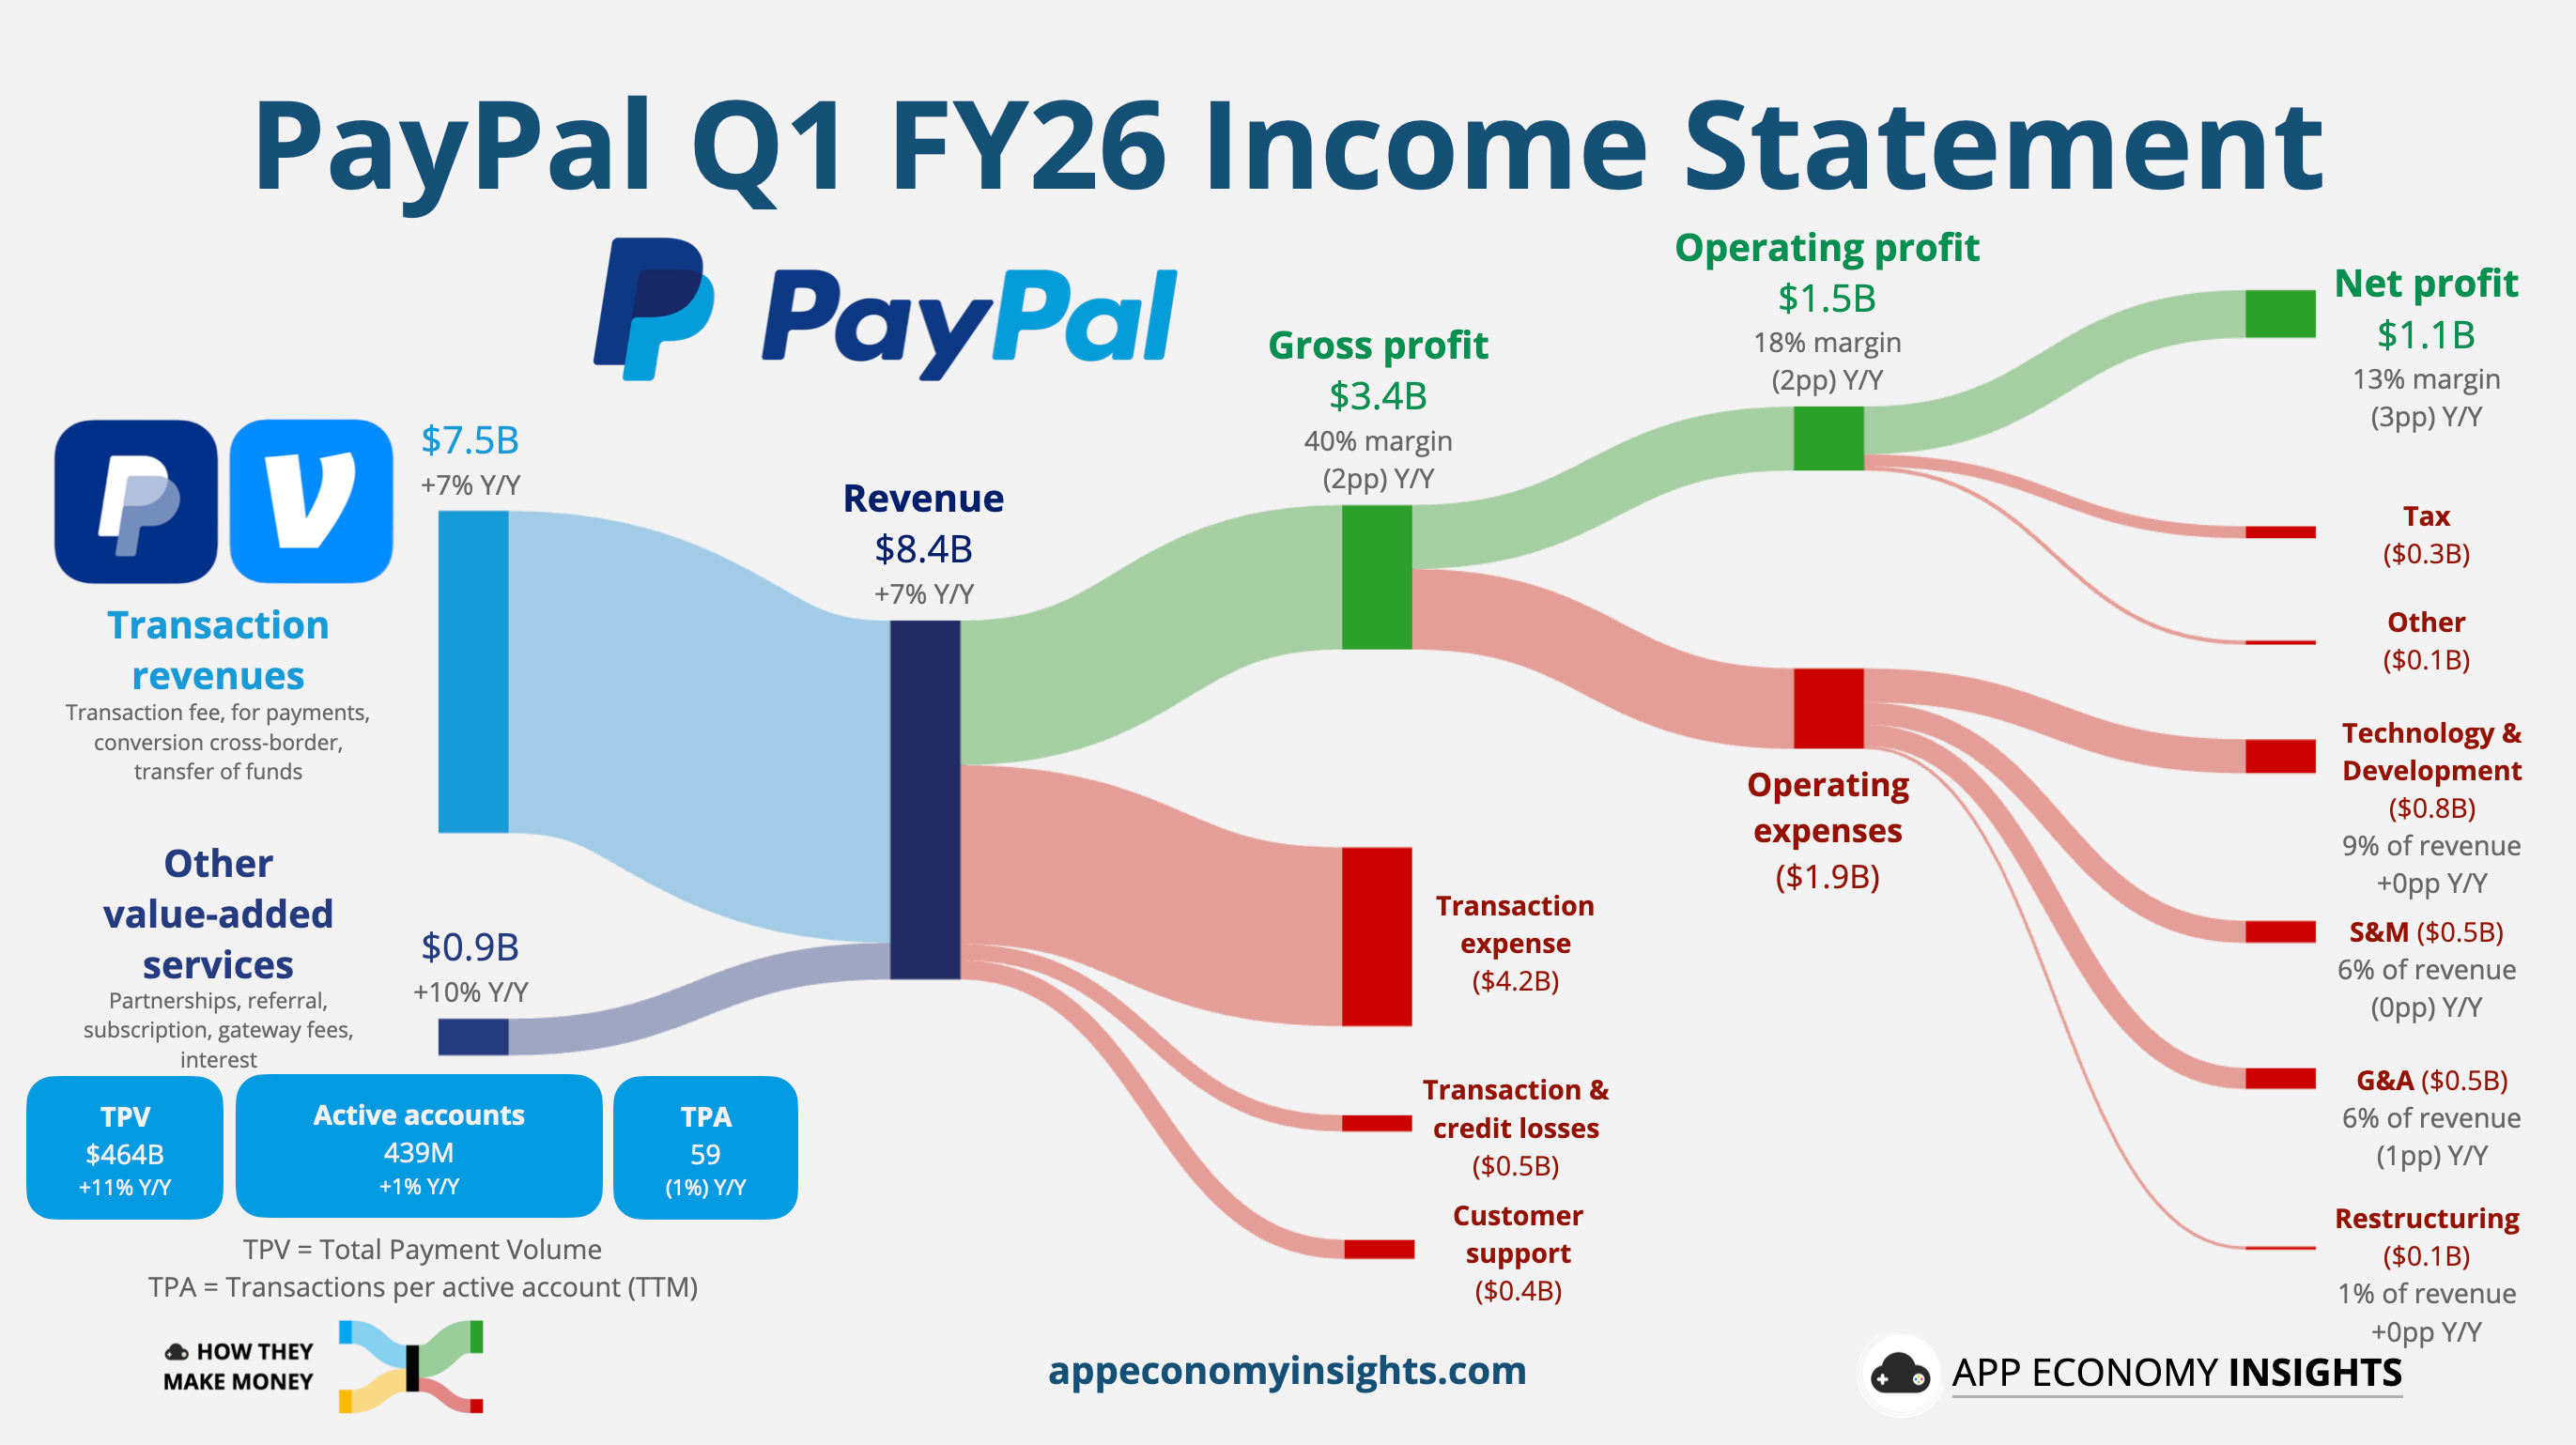
The strategic logic is straightforward. Stripe built its business by helping merchants accept payments online, becoming one of the most important infrastructure providers in digital commerce. Consumers use Stripe constantly, but most barely know it exists. PayPal brings the missing half of the network: 439 million active accounts, approximately $1.8 trillion in annual payment volume, and Venmo, one of the strongest consumer payment brands in the United States.
A combination would give Stripe a much larger presence on both sides of a transaction. Stripe could continue powering payments for merchants while PayPal, Venmo and Stripe’s Link wallet deepen its relationship with consumers. Braintree would add another large merchant-processing platform, while PayPal’s stablecoin and crypto assets would complement Stripe’s recent acquisitions of Bridge and Privy.
In theory, that creates one of the most comprehensive payment ecosystems in the world. In practice, Stripe would also inherit overlapping products, aging technology, and a collection of businesses PayPal has struggled to integrate. Buying PayPal could accelerate Stripe’s expansion into consumer payments, but combining the two companies without distracting the faster-growing business would be a major undertaking.
For Advent, the attraction is less about strategic fit and more about cash flow. PayPal generated approximately $5.6 billion of reported free cash flow last year, or $6.4 billion on an adjusted basis. A $53 billion purchase price values the company at roughly 8 times adjusted free cash flow, before considering debt, transaction costs, and the cost of financing.
That is the kind of setup private equity looks for. It’s a durable but unloved business, with strong cash generation, and a cost structure that can still be cut. Away from the public market, PayPal could restructure more aggressively without every investment or layoff being judged against the next quarter. Stripe and Advent could eventually relist the company, sell individual assets, or separate the consumer and merchant businesses.
The offer looks generous relative to PayPal’s depressed share price, but less so relative to the cash flow and strategic assets the buyers would receive. PayPal traded above $78 only a year ago, and its network of consumers and merchants would be extremely difficult to recreate from scratch.
Michael Burry, who owns PayPal shares, has already called the proposal too low. His valuation may prove optimistic, but the broader point is reasonable: Stripe and Advent would not be offering $53 billion unless they believed PayPal could ultimately be worth substantially more.
Bottom Line: PayPal became vulnerable because investors stopped believing in its turnaround. Stripe and Advent are betting that the assets are worth more than the public company built around them. At $60.50 per share, shareholders receive a clean exit from years of underperformance. But the first offer may establish only that PayPal is in play, not the price that ultimately gets it sold.
Thanks to Fiscal.ai for being our official data partner. Create your own charts and pull key metrics from 50,000+ companies directly on Fiscal.ai. Save 15% with this link.
Disclosure: I own AMZN, META, and NFLX in App Economy Portfolio. I share my ratings (BUY, SELL, or HOLD) with App Economy Portfolio members.
Author's Note (Bertrand here 👋🏼): The views and opinions expressed in this newsletter are solely my own and should not be considered financial advice or any other organization's views.
2026-07-15 01:20:45
Welcome to the Premium edition of How They Make Money.
Over 300,000 subscribers turn to us for business and investment insights.
In case you missed it:
A new earnings season is here with the big banks kicking us off.
Later this week, we’ll have a look at Netflix and the picks and shovels of the AI era, TSMC and ASML.
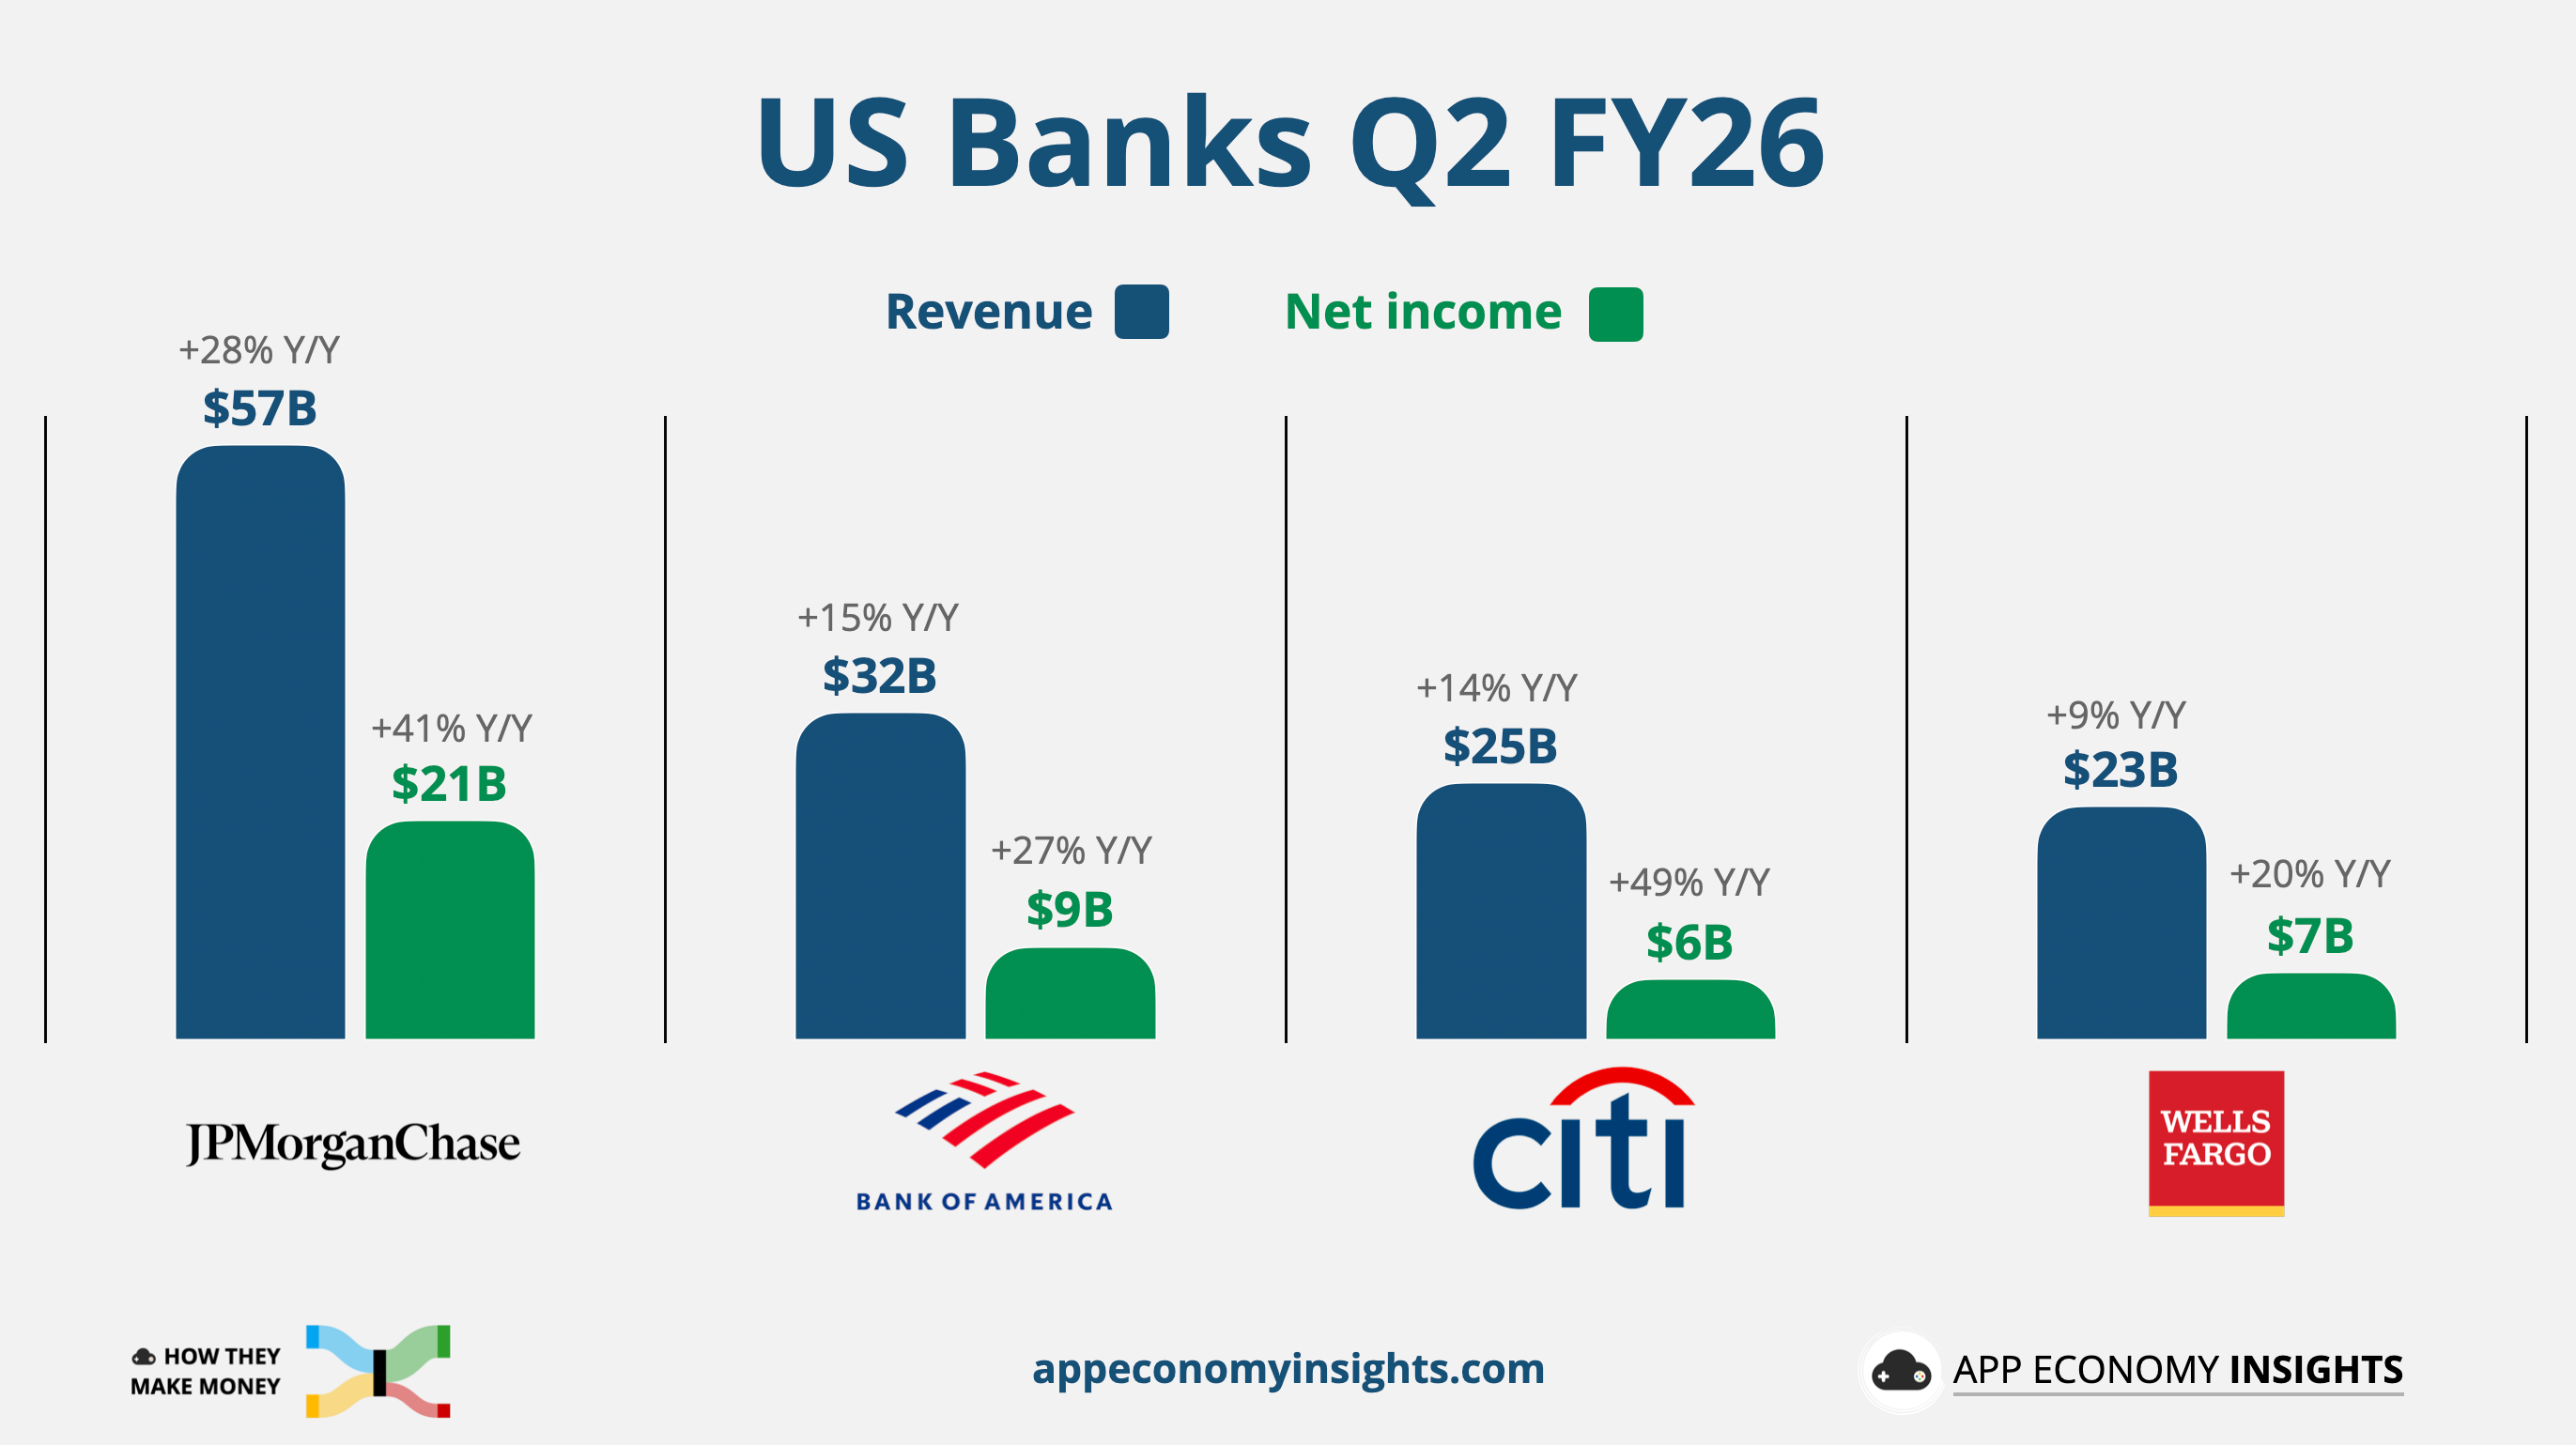
Four of the largest US banks just booked a combined $43 billion in profit, smashing records and beating estimates. They did it despite the Iran war, sticky inflation, and mounting doubts about the staying power of the AI boom.
Even as profits hit new records, the bank chiefs kept pointing to risks shifting beneath the surface: geopolitics, sticky inflation, and elevated asset prices.
High rates and market volatility are a windfall for the banks, while the gap keeps widening between households riding record markets and those squeezed by the cost of living.
Let’s break down the results.
Today at a glance:
JPMorganChase: As Good As It Gets
Bank of America: A Blowout With Caveats
Citigroup: Four Out of Five
Wells Fargo: Fees Do the Heavy Lifting
As a reminder, banks make money through two main revenue streams:
💵 Net Interest Income (NII): The difference between interest earned on loans (like mortgages) and interest paid to depositors (like savings accounts). It’s the primary source of income for many banks and depends on interest rates.
👔 Noninterest Income: The revenue from services unrelated to interest. It includes fees (like ATM charges), advisory services, and trading revenue. Banks relying more on noninterest income are less affected by interest rate changes.
Here are the significant developments shaping Q2 FY26:
💰 Records fall across the board: The four biggest lenders beat expectations despite the Iran war and sticky inflation. The common engine was the trading floor. Every desk cashed in on a volatile quarter, and the results were strong enough that Jamie Dimon told analysts conditions are “getting close to as good as it gets.”
🎰 Trading and dealmaking do the work: Equities desks set records nearly everywhere, led by JPMorgan (+86% Y/Y). A dealmaking revival capped by the SpaceX IPO pushed investment banking to its best showing since 2021. Volatility that could have been a threat became the quarter’s biggest profit source.
🏦 Margin divergence: Beneath the capital-markets boom, the lending picture split. JPMorgan raised its full-year net interest income guide, but net interest margins compressed at Bank of America, Citi, and Wells Fargo as deposit costs stayed stubbornly high. The easy-money era of NII growth is uneven, and the banks leaning hardest on rates are feeling it most.
💵 Capital floods back to shareholders: Confidence showed up in the payouts. JPMorgan authorized a fresh $50 billion buyback and a 10% dividend hike, Wells Fargo repurchased ~$7 billion in the first half and lifted its dividend 11%, and Citi and BofA kept returning capital aggressively. With balance sheets flush, the big banks are signaling they see more room to run.
🛢️ Energy relief, already reversing: June CPI cooled to +3.5% Y/Y, driven almost entirely by a 9.7% drop in gasoline after the Iran ceasefire reopened the Strait of Hormuz. That relief is unwinding fast. The ceasefire collapsed on July 8, oil is climbing again, and the July inflation print will look very different.
📉 The K-shaped consumer holds: Card spending rose 9% Y/Y at both BofA and Wells Fargo, and provisions came in below expectations across the group, signs the consumer is still spending and paying on time. But management remained cautious about affordability for lower-income households, and the divide between asset-rich households and everyone else remains.
🌋 Risks below the surface: Even while celebrating records, Dimon warned of “risks shifting below the surface like tectonic plates,” naming geopolitical conflict, sticky inflation, large fiscal deficits, and elevated asset prices. Charlie Scharf echoed him, cautioning that favorable conditions “do not go on forever.”
🔑 Takeaway: The big banks are posting record profits amid a trading and dealmaking boom, returning capital freely, and leaning on a consumer that’s still holding. But margins are thinning where the boom isn’t reaching, and management keeps pointing to the same tensions that leave little room for error.
Let’s visualize them one by one and highlight the key points.
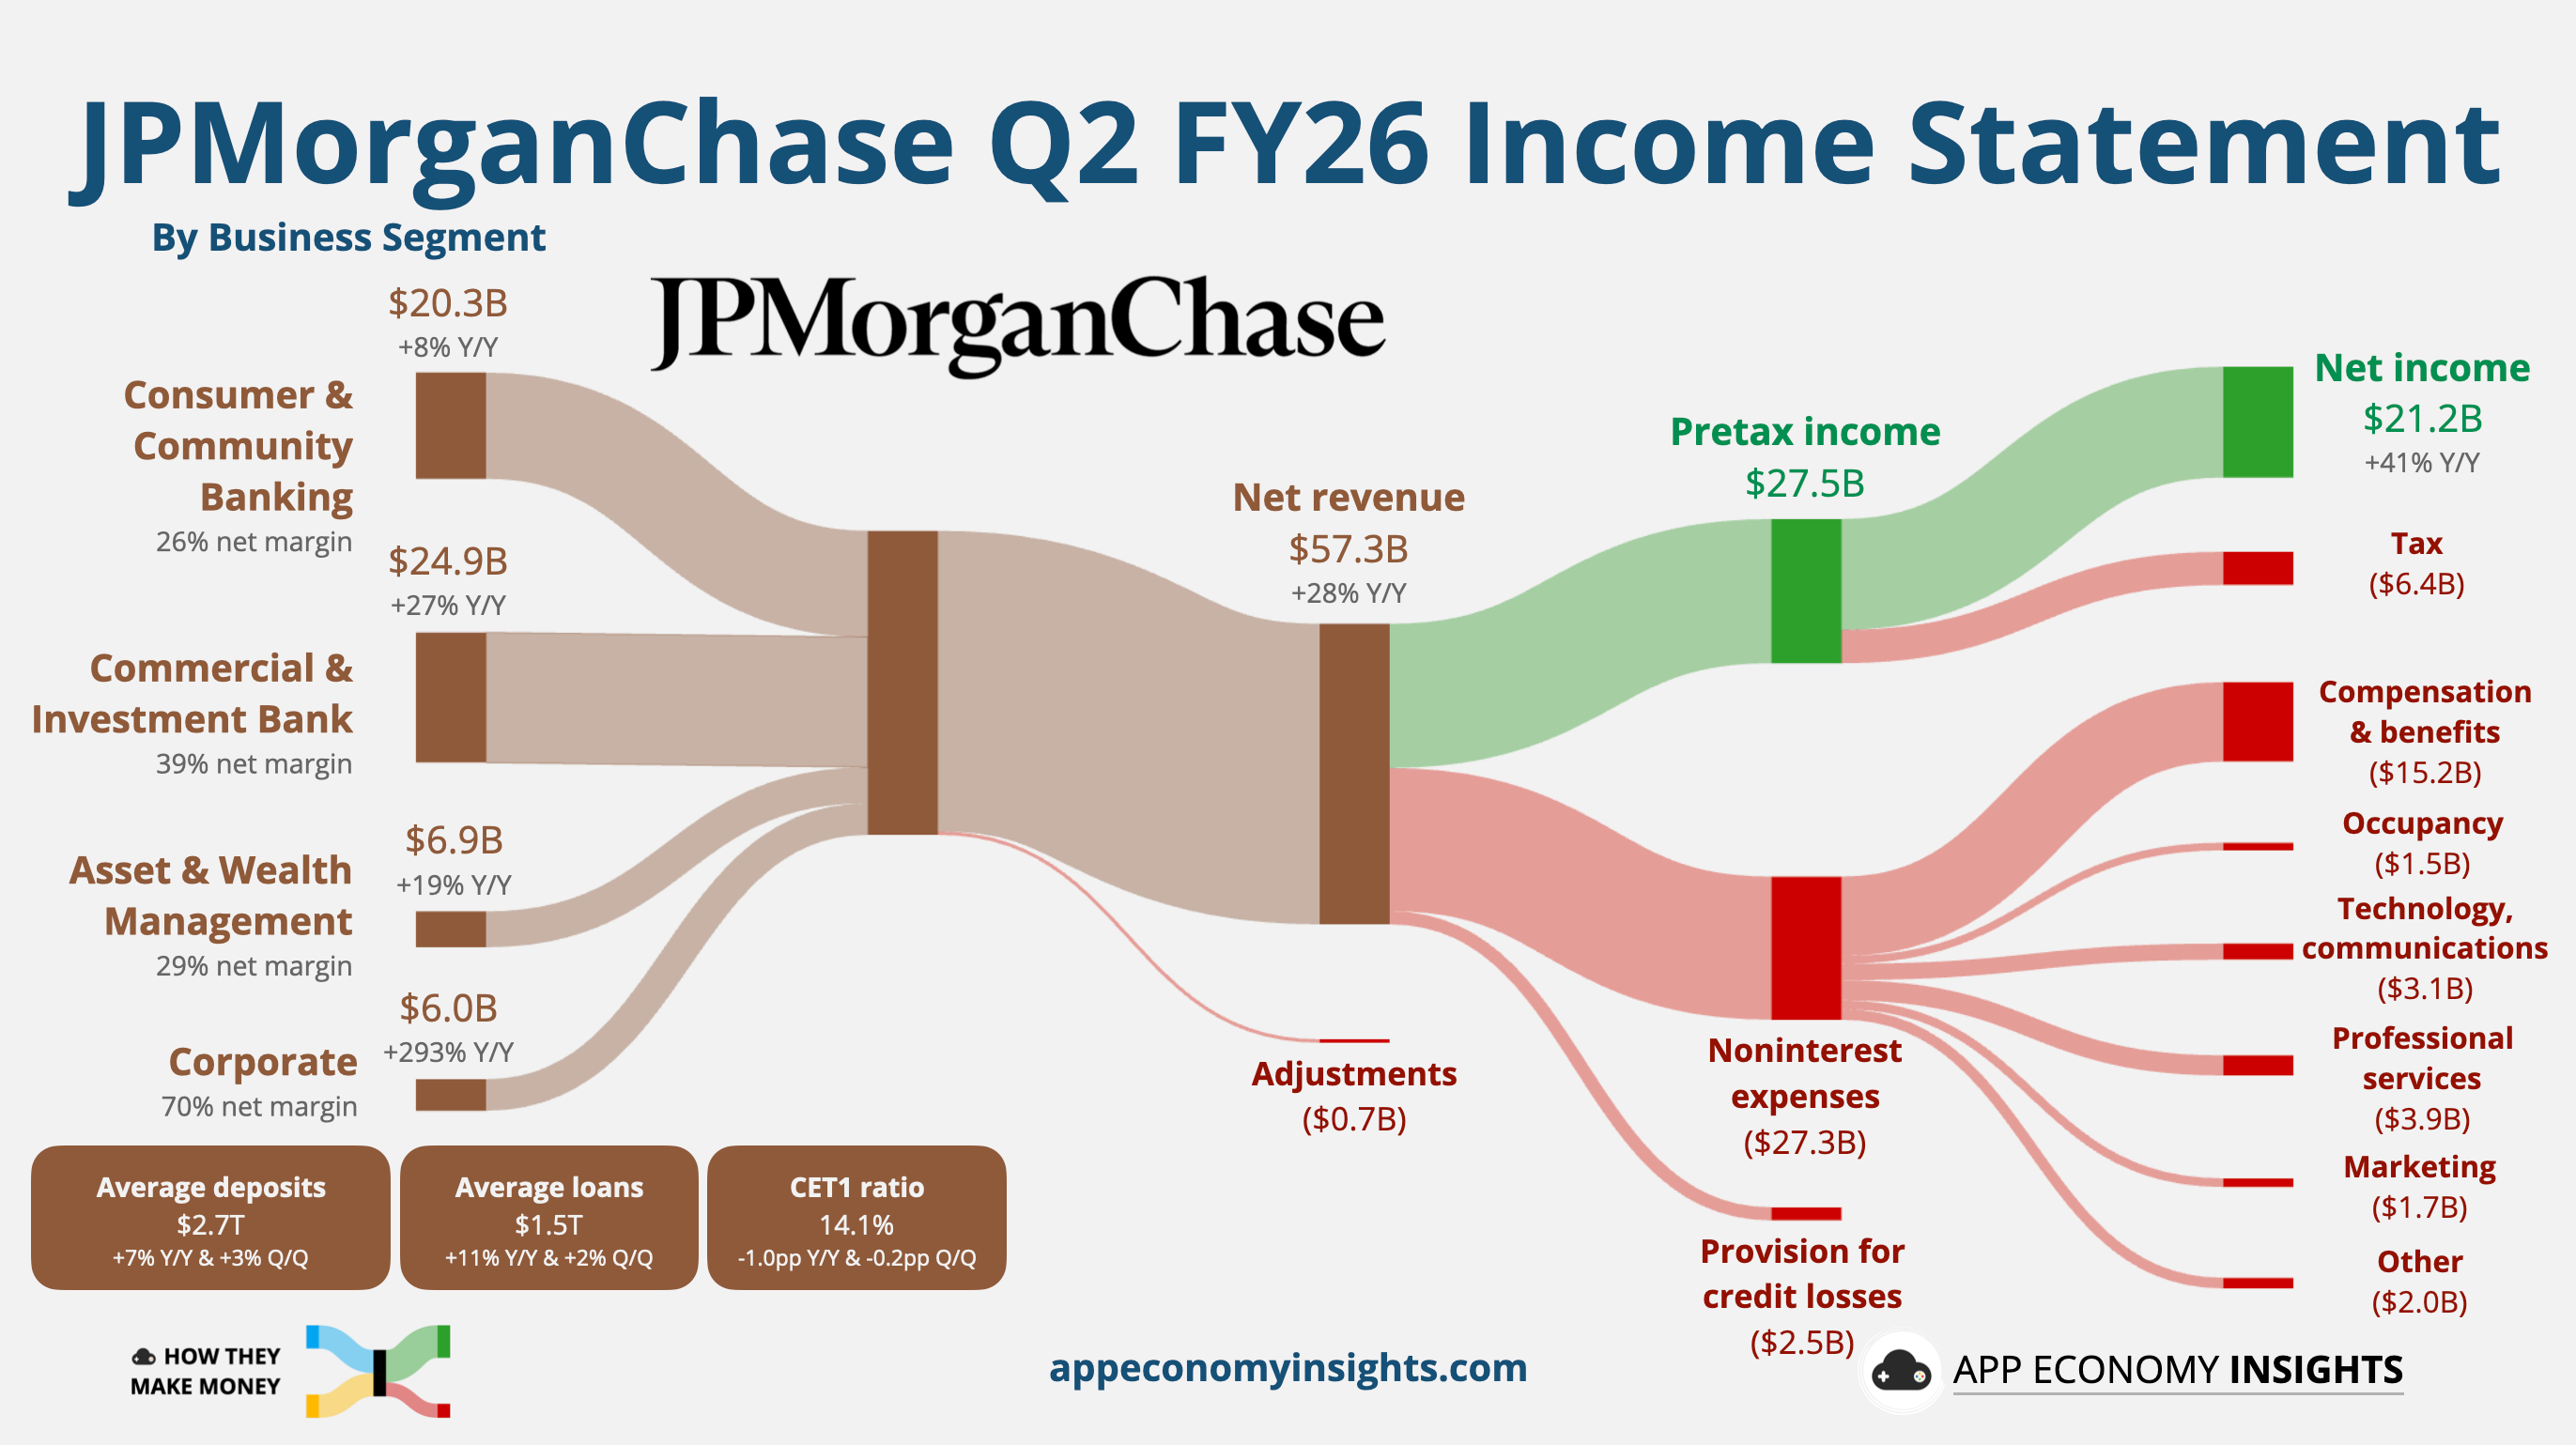
Net revenue grew 28% Y/Y to $57.3 billion ($6.7 billion beat):
Net interest income (NII): $25.5 billion (+10% Y/Y).
Noninterest income: $31.8 billion (+47% Y/Y), lifted by a $4.6 billion one-time Visa gain.
Net income: $21.2 billion (+41% Y/Y).
Adjusted EPS: $6.14 ($0.34 beat).

Key developments:
📈 Equities smash the record: JPMorgan’s stock traders pulled in $6.0 billion (+86% Y/Y), beating even the highest analyst estimate and pushing total trading revenue to a fresh record of $12.1 billion (+35% Y/Y). The volatility that started with the Iran war and rippled through global equity markets, including a chaotic stretch in Korean stocks, handed the desks their best quarter ever.
💳 The Visa windfall: A long-held Visa stake paid off to the tune of $4.6 billion, plus another $1.0 billion in equity investment gains. Reported EPS of $7.70 crushed consensus, but ~$1.56 of that was one-time. Even excluding the windfall, the bank still delivered a 23% return on tangible equity.
🚀 Dealmaking roars back: Investment banking fees jumped 30% Y/Y to $3.3 billion, riding the record SpaceX IPO, heavy index rebalancing, and a wave of AI-related financing. M&A advisory rose 20%, though that fell short of the 27% expected by analysts. CFO Jeremy Barnum called the environment “dynamic and interesting across a whole variety of dimensions.”
🏦 NII guidance raised: Management lifted the NII outlook to ~$105.5 billion (from $103 billion), as higher-for-longer rates extend the tailwind. The card net charge-off forecast also improved, to ~3.2% from 3.4%, a sign that consumer credit is holding better than feared.
💸 Expenses are the catch: Full-year expense guidance climbed to ~$107.5 billion (from $105 billion). Management framed the increase as the cost of doing more business, tied to the elevated activity levels that drove the revenue outperformance.
💰 Capital floods back to shareholders: JPMorgan raised its quarterly dividend 10% to $1.65 and authorized a fresh $50 billion buyback, with CET1 at a comfortable 14.1%. With Dimon having pegged excess capital near $40 billion, the firm has ample room to keep returning cash even as Basel III capital rules loom.
🔑 Takeaways: Every business line set records, and the NII guide flipped from headwind to tailwind versus Q1. Underneath a one-time Visa boost, JPM showed it can monetize volatility, dealmaking, and higher rates all at once.
Key quote:
CEO Jamie Dimon: “These results were the product of a particularly favorable environment with an elevated level of market activity, as well as rigorous execution, years of consistent investment, and thoughtful capital deployment.”