2025-07-11 20:02:39
Welcome to the Free edition of How They Make Money.
Over 200,000 subscribers turn to us for business and investment insights.
In case you missed it:
NVIDIA just made history as the first company ever to hit a $4 trillion market cap. That makes it bigger than Google and Meta combined, and more valuable than 214 of the smallest S&P 500 companies put together.

It’s a staggering milestone for a company that, just two years ago, was worth $750 billion. Now it commands 7.5% of the entire S&P 500, and investors aren’t done bidding it up.
The catalyst? AI, AI, AI.
NVIDIA’s chips power the AI arms race across OpenAI, Meta, Microsoft, Google, and Amazon. Together, they’re expected to spend $350 billion on capex this year, much of it earmarked for AI infrastructure.
Since early 2023, NVIDIA’s stock has surged over 1,000%, fueled by demand for its Hopper and Blackwell GPUs. And despite trade tensions and export controls, demand remains insatiable. As hyperscalers rush to build AI data centers, NVIDIA is selling the picks and shovels.
CEO Jensen Huang, now a Silicon Valley icon in his leather jacket, has called this a "new industrial revolution." And despite the historic run, NVIDIA still trades at ~33× forward earnings, below its 10-year average, suggesting the valuation hasn’t outrun its fundamentals.
The next catalyst? Earnings in late August. If NVIDIA beats and raises again, as it often does, that $4T badge may be just another stop on the way up.
Today at a glance:
👓 Meta’s €3 billion bet
🤖 AI-induced layoffs are here
🐶 Datatog Joins the S&P 500
💰 Thoma Bravo’s SaaS delisting machine

In between interviews to poach top AI talent, Zuck just invested €3 billion for a 3% stake in EssilorLuxottica—parent company of Ray-Ban and Oakley—doubling down on AI-powered smartglasses.
And who can blame him? Ray-Ban Meta glasses have sold over 2 million units, and Meta aims for 10 million per year by 2027.
EssilorLuxottica is no ordinary eyewear company. It commands nearly 40% global market share in lenses and frames, with FY24 results showing €26.5 billion in revenue and €3.3 billion in net profit.

Meta’s move puts EssilorLuxottica at the heart of the wearable AI race. It’s the supersized version of Google’s investment in Warby Parker we previously covered. 👇
And to make sure the hardware has the brains to match, Meta just poached Ruoming Pang, Apple’s top AI engineer behind the foundational models powering Apple Intelligence. According to Bloomberg, he received a pay package worth more than $200 million over several years. The AI talent war rages on.
Microsoft is cutting another 9,000 jobs, its third major layoff this year, following 2,000 roles in January and nearly 7,000 in May. That’s ~4% of its global workforce gone, as the company doubles down on its AI pivot.
Sales and gaming units were hit the hardest, with a clear theme: out with old-school sales specialists and middle managers, in with AI-savvy engineers and leaner teams. Xbox, Bethesda, and King saw roles axed, while Redmond HQ was the most impacted by the restructuring. As Microsoft pours billions into AI infrastructure, it's reshaping the org to match and trading headcount for horsepower.
It’s not just Microsoft. We’ve seen this movie before:
Meta’s “year of efficiency” in 2023 kicked off a wave of cost discipline across Big Tech, after years of pandemic-fueled overhiring.
Google, Salesforce, Amazon, and CrowdStrike have all trimmed headcount in recent months, often in the name of AI reorganization or cost discipline.

🔎 A recent Deloitte survey found that many corporate boards are targeting up to 20% cost reductions via AI-driven productivity gains, even as CIOs ramp up hiring for AI-specific roles. Marc Benioff said last month that AI is doing “30% to 50% of the work at Salesforce now."
There’s a tale of two tech worlds right now:
AI leaders and researchers are commanding NBA All-Star–level bonuses.
Meanwhile, thousands of roles are being quietly eliminated—either to offset soaring AI infrastructure costs or because those jobs are no longer needed.
The result? Less tech winter, more AI harvest season. If your role doesn’t feed the AI flywheel, it may be on the chopping block.
Datadog replaced Juniper Networks in the S&P 500 earlier this week. This milestone sparked a stock surge and briefly pushed the cloud monitoring platform’s market cap above $50 billion.
Getting into the S&P 500 takes more than size. Companies must meet strict criteria across several dimensions:
Headquarters in the US.
Listing on a major US exchange.
A market cap of over $20 billion.
Sufficient liquidity and trading volume.
Show consistent profitability over the last 5 quarters.
Datadog checks all the boxes after a clear pivot to profitability. While the company turned a small operating loss in Q1 FY25, it has been profitable on a trailing-12-month basis for the past five quarters.

Every S&P reshuffle creates buzz about who might be next.
Here are the leading contenders:
AppLovin (ad-tech): Massive $115+ billion market cap.
MicroStrategy: Huge market cap over $110+ billion but tied up in Bitcoin.
Robinhood: $80+ billion market cap and massive user base, but the committee may still be wary of its earnings consistency.
The key takeaway? Even sustained profitability and a massive market cap aren't always enough. The S&P 500 committee weighs multiple factors, from free float to voting structure to sector balance, and keeps some decisions close to the vest. For companies like AppLovin, the wait may be more a matter of when, not if.
Thoma Bravo is buying restaurant-tech platform Olo for $2.0 billion, a 65% premium over its unaffected share price.
Olo was doing well on its own, with positive cash flow and inching toward profitability in its latest quarter, along with a healthy net revenue retention of 111% and revenue growth of 21% Y/Y.
With over 750 brands on its ordering platform—including Denny’s, P.F. Chang’s, and Shake Shack—Olo joins a growing list of public SaaS companies Thoma Bravo has taken private in recent years.

Over the past six years, Thoma Bravo has developed a playbook centered on acquiring vertical and enterprise SaaS leaders. Here are the largest:
Proofpoint $12.3B (2021): Email security and threat protection platform.
Digital Aviation $10.6B (2025): Boeing’s flight‑software suite.
Anaplan $10.4B (2022): Enterprise planning & performance platform.
RealPage $10.2B (2021): Property management SaaS giant.
Coupa $8.0B (2023): Spend‑management SaaS.
SailPoint $6.9B (2022): Identity governance and administration.
Darktrace $5.3B (2024): Cybersecurity AI platform.
Ping Identity $2.8B (2022): Identity‑access management.
ForgeRock $2.3B (2023): Digital identity and access platform.
Imperva $2.1B (2019): Data and app security (later sold for $3.6B).
With Olo, the firm has now deployed over $70 billion across dozens of software companies.
Thoma Bravo specializes in:
Finding category leaders with high recurring revenue.
Paying up front to unlock value through private ownership.
Driving efficiencies, bolt-on acquisitions, and long-term improvements.
Exiting through IPOs or strategic sales once momentum returns.
It’s a deliberate consolidation of SaaS infrastructure, one niche at a time.
The market giveth, and the market taketh away.
The Olo deal fits the mold: category leadership, recurring revenue, and margin expansion potential. While the board may see it as a win, public shareholders are left on the sidelines. Even if Thoma Bravo’s playbook pays off, an all-cash offer means no future upside for the rest of us.
That’s it for today!
Stay healthy and invest on!
Disclosure: I am long AAPL, AMZN, DDOG, GOOG, META, NVDA, and TSM in App Economy Portfolio. I share my ratings (BUY, SELL, or HOLD) with App Economy Portfolio members.
Author's Note (Bertrand here 👋🏼): The views and opinions expressed in this newsletter are solely my own and should not be considered financial advice or any other organization's views.
2025-07-08 20:03:25
Welcome to the Premium edition of How They Make Money.
Over 200,000 subscribers turn to us for business and investment insights.
In case you missed it:

Figma has officially filed to go public, marking one of the most anticipated software IPOs in recent memory.
The collaborative design platform has become a staple for millions of designers and developers, famously turning the browser into a design canvas and reshaping how teams build digital products.
This S-1 finally reveals what many suspected: Figma isn’t just a great product—it’s a great business.
In 2022, Adobe announced plans to acquire Figma for $20 billion—but regulators had other ideas. After a year of scrutiny, the deal collapsed in late 2023 due to antitrust concerns in the US, UK, and Europe. Adobe paid Figma a $1 billion breakup fee, and the company stayed independent.
Now Figma is aiming to earn that $20 billion valuation on its own terms.
The numbers are impressive:
$749 million in FY24 revenue, up 48% year-over-year.
Over 1,000 customers paying $100K+ annually.
95% of Fortune 500 use Figma.
And it's just getting started. Figma now has 13 million monthly active users. And remarkably, two-thirds are not designers. The company is evolving from a design tool into a full-stack product platform.
I went through all 300+ pages of Figma’s S-1 so you don’t have to.
Here’s what we learned.
Today at a glance:
Overview
Business Model
Financial highlights
Risks & Challenges
Management
Use of Proceeds
Future Outlook
Personal Take
Figma is a browser-based platform for collaborative design and product development. Its tools are used to brainstorm, wireframe, prototype, and ship digital products—all in one place and in real time.
The company was founded in 2012 by Dylan Field and Evan Wallace. It launched to the public in 2016 and began monetizing in 2017. What followed was one of the most explosive runs in SaaS history.
Today, Figma claims more than 13 million monthly active users, and its tools are used across a wide range of functions—not just by designers, but by product managers, engineers, marketers, and executives.
Headquarters: San Francisco, California.
Mission: Make design accessible to everyone.
Ticker: FIG (Nasdaq).
Figma is evolving into a full product development suite used by 100% of the Fortune 100, including companies like Microsoft, Stripe, Airbnb, and Zoom. The company has quietly added new tools that map to every stage of the product lifecycle:

🧠 Ideate: FigJam (for whiteboarding and brainstorming), and Figma Slides (for real-time presentations with embedded design elements).
🎨 Design: Figma Design (the flagship UI tool), and Figma Draw (a dedicated vector editing space for detailed illustrations).
👨💻 Build: Dev Mode, a developer-focused workspace to inspect designs, view documentation, and streamline handoff.
🚀 Ship: Figma Sites, which lets users turn designs into working websites with responsive layouts, motion effects, and code layers.
📣 Promote: Figma Buzz, a tool to create on-brand marketing assets like social media graphics and digital ads.
⚡ Prototype with AI: Figma Make, an early AI-driven tool that turns prompts into working prototypes—potentially skipping traditional wireframing.
Together, these tools expand Figma’s reach across the entire product lifecycle—unlocking more users, more use cases, and more revenue per account.
Figma’s key innovation was redefining how design software is delivered:
Web-first: No install required. Works across Windows, Mac, and Linux.
Multiplayer by default: Think Google Docs, but for design—multiple users can design, comment, and edit simultaneously.
Community-driven: Thousands of plugins, templates, and widgets created and shared by users.
This combination gave Figma a distinct edge over incumbents like Adobe, which were slower to embrace browser-native, collaborative workflows.
In September 2022, Adobe announced it would acquire Figma for $20 billion in cash and stock, one of the largest private tech acquisitions ever.
But in December 2023, the companies terminated the deal after mounting regulatory pressure in both the US and Europe. Adobe paid Figma a $1 billion breakup fee, and Figma retained full independence.
Now, with IPO proceeds on the horizon, Figma is out to prove it didn’t need a buyer to scale. It’s aiming to become a public-market leader on its own.
Figma is a classic product-led growth company, with a twist.
While many SaaS companies rely on sales teams to land large enterprise deals, Figma built its business bottom-up: individuals and small teams start using the free tier, and usage spreads organically across organizations. Once usage hits critical mass, enterprise plans kick in.
It’s the kind of growth engine that’s hard to manufacture—and even harder to replicate.
Figma operates a freemium model with four plan tiers:

Starter: Free tier for individuals and early-stage teams.
Professional: Paid tier with additional access controls and features.
Organization: Designed for scaling teams with more robust admin tools.
Enterprise: Tailored for large companies with enhanced security, support, and procurement controls.
The business grows through a seat-based pricing model. Users are charged per “editor” seat, meaning only those actively creating or modifying files need a paid license. Viewer-only roles are free, which helps drive viral adoption. Figma also offers a range of seat types—Viewer, Collaborator, Content, Developer, and Full—tailored to specific workflows.
The flywheel looks like this:
A designer invites a colleague to collaborate.
That person invites a PM or engineer.
Usage spreads across functions.
Procurement steps in once the tool becomes critical infrastructure.
This is how Figma turned viral adoption into:
11,000+ customers spending over $10,000 ARR (annual recurring revenue).
1,000+ customers spending over $100,000 ARR.

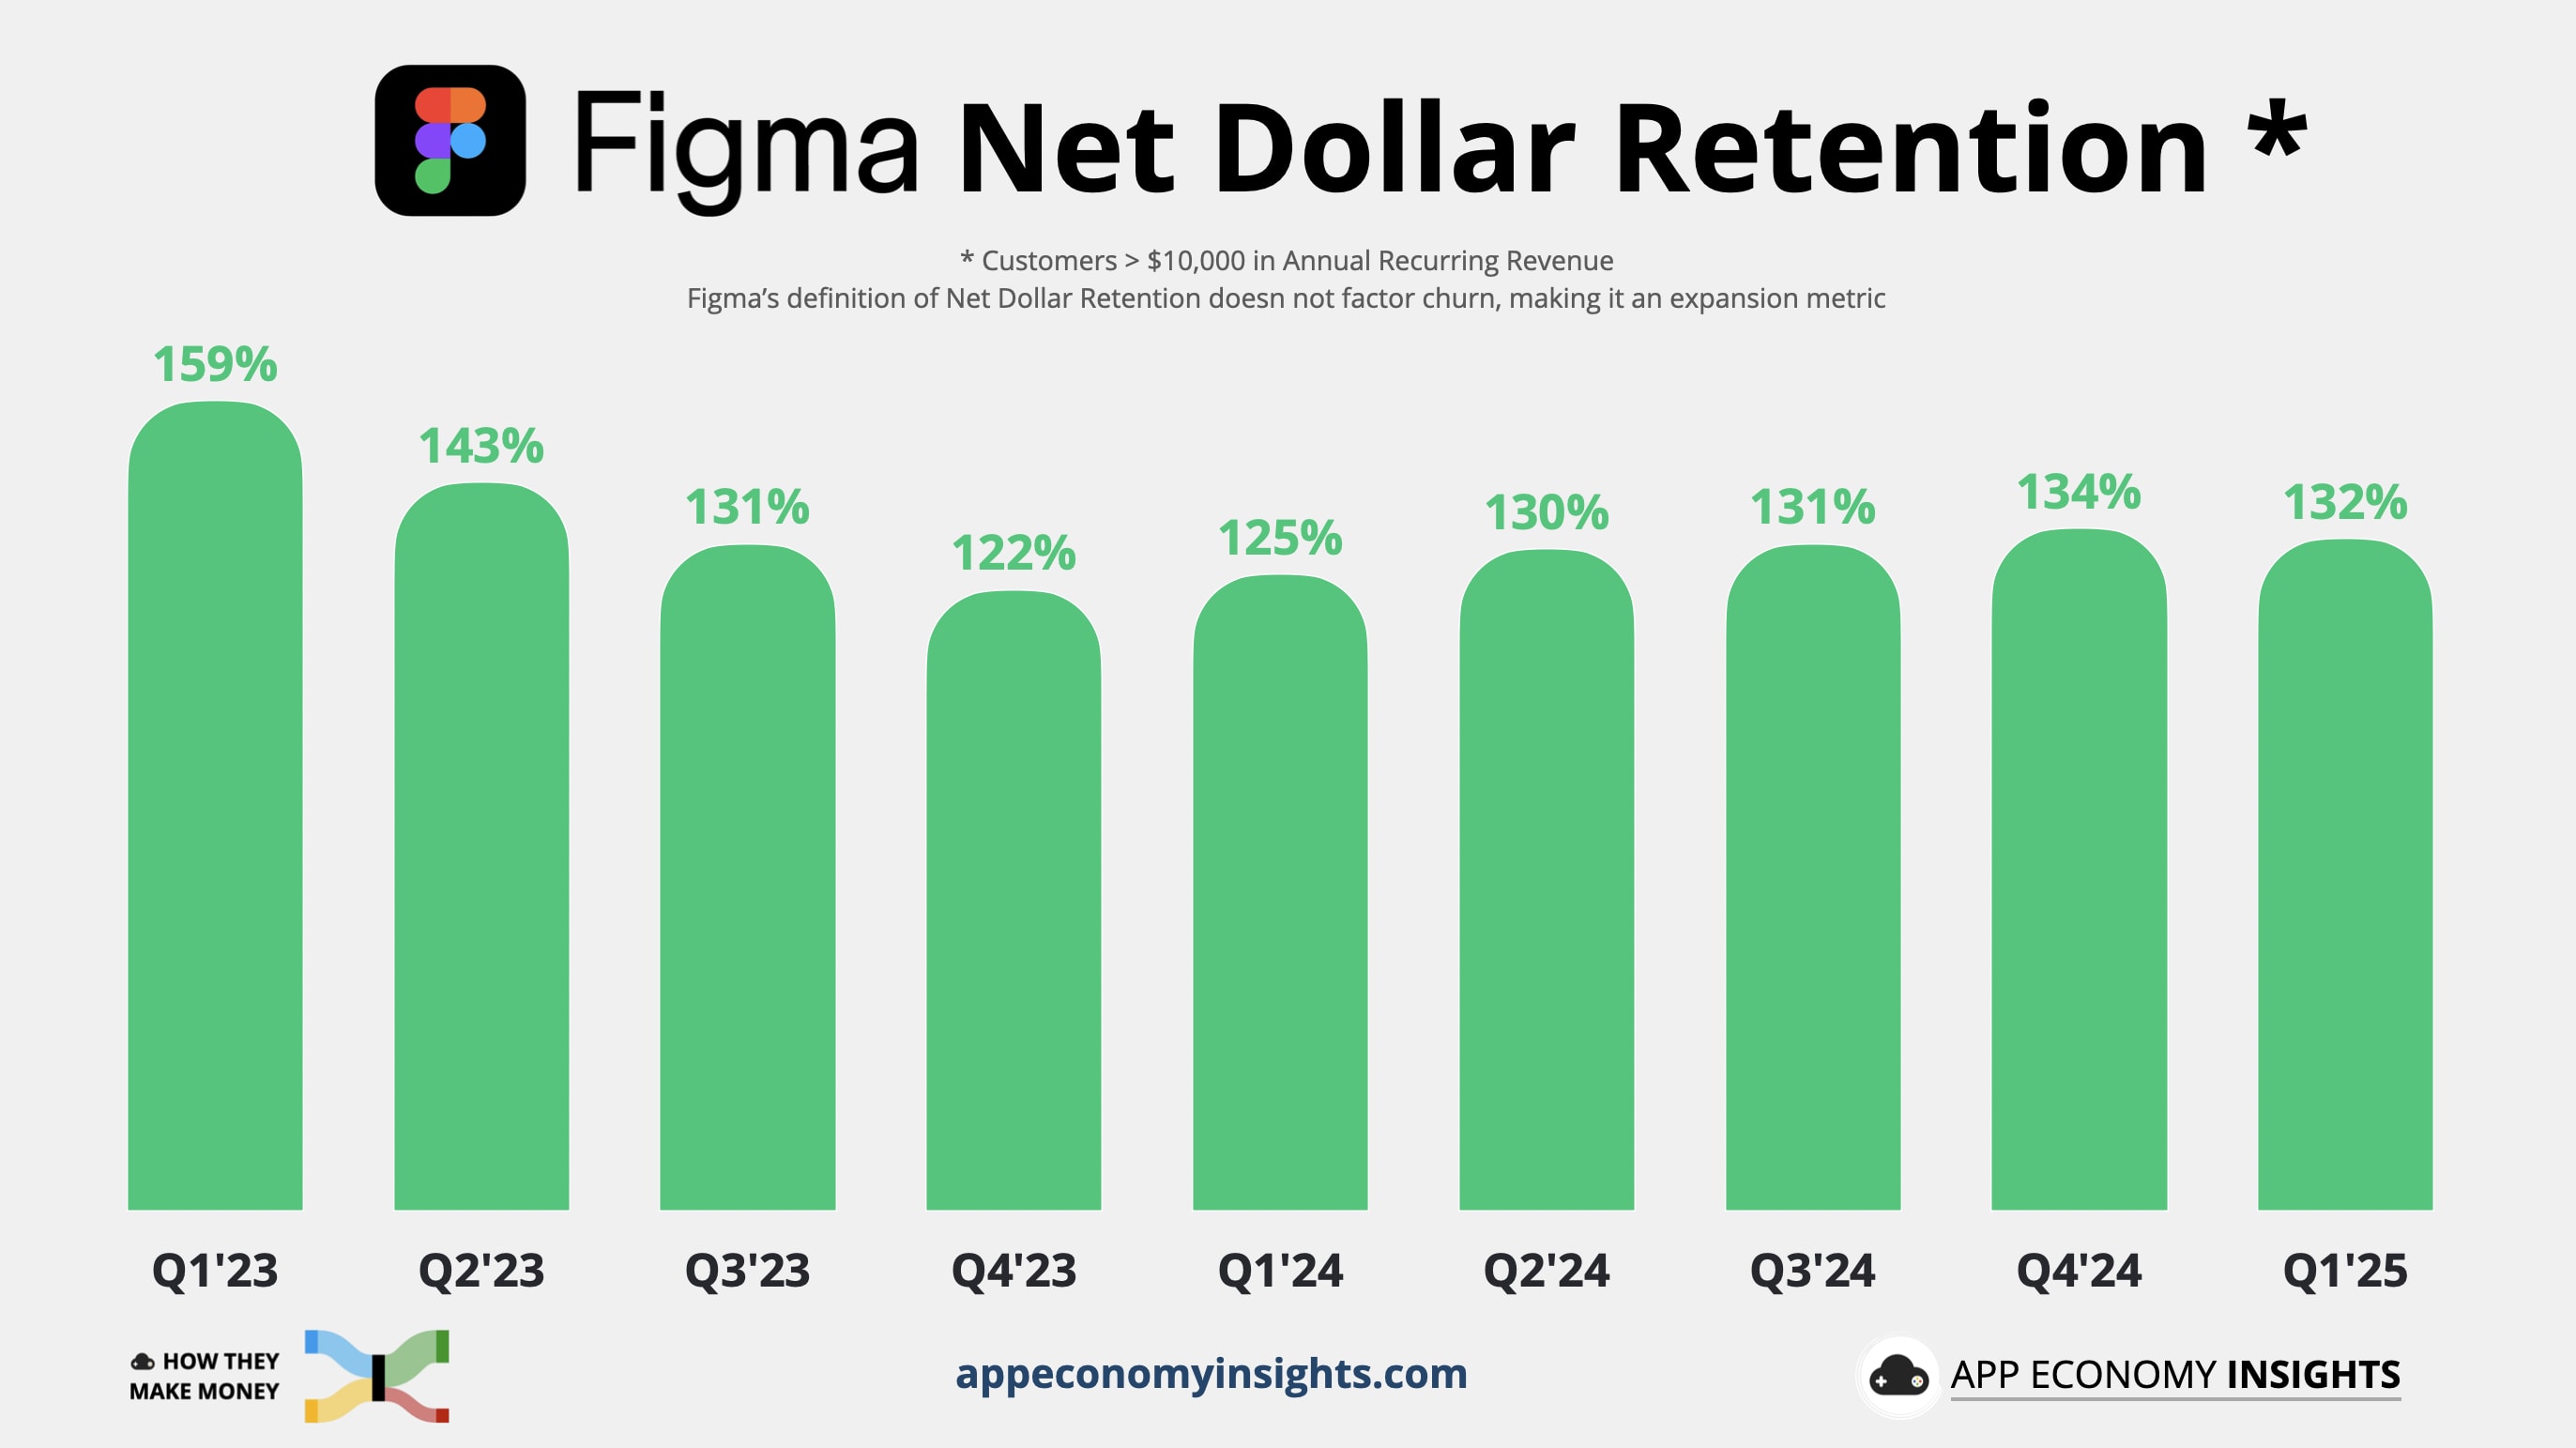
Figma’s business thrives on expansion:
Net dollar retention hit 132% in Q1 FY25—but the fine print matters. Figma only includes customers still spending over $10,000 today, then looks back at what those same customers were spending a year ago. That makes it more of a flattering expansion rate among retained enterprise accounts, rather than a true retention metric factoring in churn. It’s undeniably impressive, but the label is misleading. It's unclear why this was even called net dollar retention in the S-1.
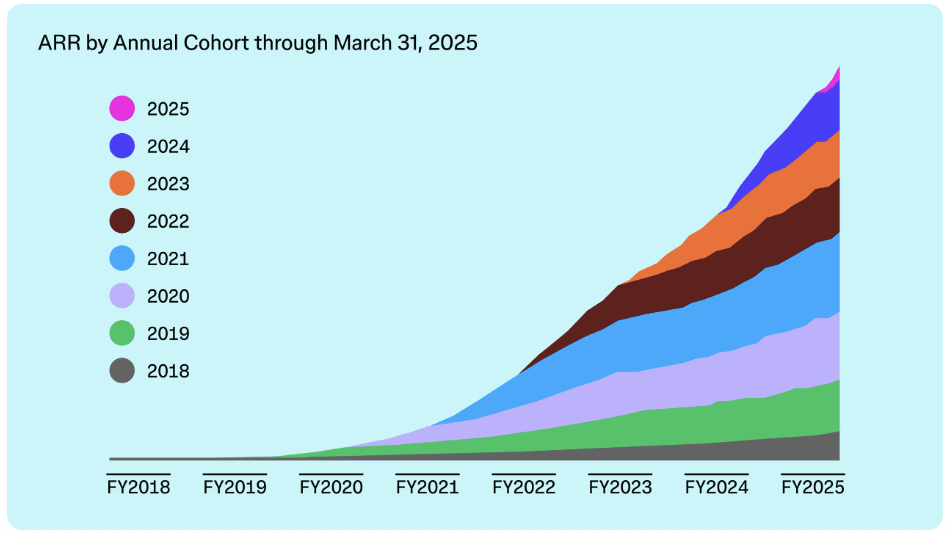
Average revenue per paying customer has climbed steadily with seat growth, cross-team expansion, and new products like FigJam and Dev Mode.
Usage-based features—like storage, commenting, and handoff tools—create more monetization opportunities as teams scale.
Figma often refers to itself as a productivity platform disguised as a design tool. That’s intentional. The company sees its market far beyond the design org. In many companies, Figma has become the connective tissue between:
Designers, building the product UI.
Engineers, inspecting files in Dev Mode.
Product managers, defining flows and specs.
Marketers and execs, giving feedback or approving designs.
This cross-functional appeal is what separates Figma from legacy tools and what opens the door to much broader enterprise budgets.
Figma’s Q1 FY25 results reflect a company with breakout SaaS economics—and a story that’s now rebounding after a one-off financial reset in 2024.
Here’s a snapshot of Q1 FY25 (ended March 2025):

Here are the most critical KPIs:
2025-07-04 20:02:32
Welcome to the Free edition of How They Make Money.
Over 200,000 subscribers turn to us for business and investment insights.
In case you missed it:

F1 The Movie just hit theaters, riding an estimated $350+ million budget across production and marketing, and a wave of high-octane ambition.
To ensure authenticity, seven-time world champion Lewis Hamilton joined as producer, and the film was shot on real circuits during race weekends, with cameos from actual F1 drivers and team bosses.
Distributed by Warner Bros., the Apple Original opening weekend delivered $144 million globally (including $56 million in the US). And with a 97% audience score on Rotten Tomatoes, it’s poised to keep momentum. The fictional APX F1 team even racked up a record $40 million in product placement, already offsetting a good chunk of the budget.
That’s welcome news for Apple after costly flops like Argylle and Napoleon. Apple TV+ has been a loss leader—not even tracked by Nielsen in the US, with a market share trailing Peacock’s modest 1.4%. You might wonder who at Apple thought Hollywood filmmaking was a good business idea. If you like glitter, sure. If you like money? Not so much. But maybe this whole affair is more about marketing and brand halo than turning a profit.
F1 Group, on the other hand, is guaranteed to win big.
Netflix’s Drive to Survive doubled F1’s US viewership, a critical market for media rights and sponsors. Now Liberty Media, owner of the F1 Group since 2017, is leveling up with Hollywood storytelling, IMAX adrenaline, and a very real business engine beneath the glamor.
Let’s pop the hood of the F1 business.
Today at a glance:
F1 Ecosystem
How F1 Makes Money
Just Netflix And Thrill
New Rights Negotiation
To understand F1’s financial engine, let’s meet the players:
🛡️ FIA: Formula 1 is a sport heavily defined by its strict rulebook. The Fédération Internationale de l'Automobile is a non-profit that ensures fair play, technical regulations, and driver safety.
🏢 Formula One Group: This entity holds the commercial rights to F1. They are the dealmakers, negotiating lucrative contracts with circuits to host races, securing broadcasting rights, and attracting major sponsors.
🏎️ F1 Teams: These ten teams design cutting-edge cars and field superstar drivers who battle it out on the track. Each includes two cars and two drivers. Some household names like Ferrari are publicly traded and included in our quarterly Earnings Visuals rotation.
✨ Sponsors: The brand ambassadors, bringing big bucks to F1 while promoting their products to a global audience.
📺 Broadcasters: Broadcasters pay a premium for the rights to air races, making F1 accessible to millions of fans worldwide. They include networks like Sky Sports, ESPN, and Canal+.
🏙️ Race Promoters: The local heroes who transform tracks into vibrant hubs and create unforgettable fan experiences. From the historic streets of Monaco to the futuristic Yas Marina in Abu Dhabi, each of the 24 races showcases local culture and helps grow F1’s global fan base.
Here’s a closer look at Formula One Group’s financial engine in FY24:

F1 brought in $3.4 billion in revenue in 2024 across four main streams:
💰 Race Promotion (29% of revenue): Circuits around the world pay hefty fees for the privilege of hosting a Grand Prix. These multi-year contracts often escalate over time, signed by a mix of track owners, auto clubs, private organizers, and governments eager to showcase their cities. In 2024, this segment grew 6% with 24 races, flat compared to 2023.
📺 Media Rights (33% of revenue): F1’s largest revenue stream comes from selling broadcasting rights. Traditional networks, regional providers, and F1’s own streaming platform (F1 TV) all deliver the action. While Netflix helped ignite global fandom, it’s not (yet) a live rights holder. US rights are up for renewal soon, more on this in a minute.
🤝 Sponsorship (19% of revenue): Big brands love the glamor and reach of F1. From race title sponsors to global partners, sponsorships include trackside signage, team partnerships, and more. As fan engagement grows, so does sponsor interest.
🎟️ Other (19% of revenue): This diverse stream includes:
Ticket sales for the Las Vegas Grand Prix (launched in 2023), where F1 Group acts as the promoter. Revenue dipped slightly as the novelty wore off in year two.
Paddock Club VIP hospitality packages.
Shipping logistics for teams and equipment.
Other licensing deals and TV production activities.
F1’s business is powered by multi-year contracts, giving it predictability and leverage across most revenue lines.

Cost of revenue and operating expenses include:
Team Payments: $1.3 billion, about 37% of revenue distributed to teams as prize money, structured around past results, bonuses, and team agreements.
Other costs (FIA fees, hospitality, commissions): $1.1 billion.
Selling, general, and administrative: $0.3 billion.
Depreciation and amortization: $0.3 billion.
Operating margin was 14% (+2pp Y/Y).
Growth of the Primary segment revenue slowed in 2024, just +8% Y/Y, compared to +21% Y/Y in 2023, partially due to no increase in race count and viewer fatigue from Verstappen’s 2023 dominance. But with lean costs and barely any marketing spend, F1 remains a cash machine.
F1 was seen as an elite, European-centric sport with a loyal (but aging) fanbase. Liberty Media had a challenge on its hands.
Then came Netflix and its Drive to Survive docuseries, which redefined how global sports are marketed.

Now in its seventh season, Drive to Survive remains a cultural force. The show has leaned into the human drama behind Verstappen’s dominance, spotlighting rising stars like Oscar Piastri and exposing team tension at Mercedes and Ferrari. Even as race outcomes became predictable, the off-track storytelling kept fans emotionally invested.
Netflix helped transform F1’s drivers and team principals into global personalities. Drivers like Daniel Ricciardo, Lando Norris—and even team principals like Toto Wolff and Christian Horner—became breakout stars.
According to Nielsen Sports, F1's global fanbase hit 827 million in 2024—up 12% Y/Y, thanks in part to the return of the Chinese Grand Prix.
A YouGov Sports whitepaper found that 1 in 4 fans cite Drive to Survive as a “major reason” they follow the sport.
The average F1 race drew 85 million viewers in 2024 across broadcast and digital platforms.
Even better for Liberty Media: these fans aren’t passive viewers. They’re younger, more diverse, and far more active online—exactly the kind of audience sponsors crave.
Could F1: The Movie deliver the same breakout buzz as Drive to Survive?
Since Liberty Media took over in 2017, Formula 1 has shifted gears, evolving from a Eurocentric sport into a global entertainment engine.
Now, US broadcast rights are up for grabs, and the battle could reshape F1’s American future. ESPN’s current deal is expiring at the end of the 2025 season. Liberty wants a major raise. But ESPN is reportedly unwilling to go beyond $85 million a year.
A lot is riding on it—literally. After a post-Drive to Survive boom, US viewership plateaued, weighed down by Verstappen’s 19-win domination in 2023, killing the suspense. But 2025 is already looking racier: average US viewership has rebounded to a record 1.3 million per race so far, hinting that unpredictability is back, and so is fan engagement.
To be sure, interest in following races live is not growing as fast as the fan base, indicating that the new younger fans who discovered F1 via Netflix may be less inclined to watch races live.

Enter the streaming giants. Netflix, Amazon, Apple, and NBC (Peacock) are all rumored contenders for the next rights package. Each wants a piece of the F1 engine—whether for live viewership, international expansion, or brand prestige.
And this is where Apple’s $350+ million bet on F1 The Movie might shift the odds.
The company has already dabbled in MLB (baseball) and MLS (soccer), and it’s made no secret of its interest in live sports. A blockbuster F1 film, paired with the global rights to the real thing? That would be a podium finish.
That’s it for today!
Stay healthy and invest on!
Disclosure: I am long AAPL, AMZN, NFLX, and LYV in App Economy Portfolio. I share my ratings (BUY, SELL, or HOLD) with App Economy Portfolio members.
Author's Note (Bertrand here 👋🏼): The views and opinions expressed in this newsletter are solely my own and should not be considered financial advice or any other organization's views.
2025-07-01 20:00:23
Welcome to the Premium edition of How They Make Money.
🔥 The June report is here!
All the key earnings visuals from the past month in one report.
✔️ Cut through the noise with clear, concise financial snapshots.
✔️ See revenue trends, profit margins, and key takeaways instantly.
We visualized 200+ companies this season:
In case you missed it:
Download the full report below or log in to your account.
Your voice matters! Help us shape future reports. Got a company or sector you're curious about? Hit 'Reply' and let us know!
Here’s a sneak peek. 👀

🚙 Auto: NIO.
🌯 Franchises: Darden.
🥫 FMCG: General Mills.
👔 Consulting: Accenture.
🎽 Apparel: Nike, Lululemon.
🩺 HealthCare: HealthEquity.
⚙️ Semis: Broadcom, Micron.
😎 Tourism: Carnival, Vail Resorts.
🛡️ Security: CrowdStrike, SentinelOne.
💼 Enterprise Software: Adobe, Oracle.
☁️ Productivity: Asana, DocuSign, GitLab.
📊 Data & Infrastructure: HPE, MongoDB, Rubrik, Samsara.
And more, like StoneCo, Chewy, FedEx, and GameStop.
2025-06-28 22:01:13
Welcome to the Saturday PRO edition of How They Make Money.
Over 200,000 subscribers turn to us for business and investment insights.

In case you missed it:
📊 Monthly reports: 200+ companies visualized.
📩 Tuesday articles: Exclusive deep dives and insights.
📚 Access to our archive: Hundreds of business breakdowns.
📩 Saturday PRO reports: Timely insights on the latest earnings.
Today at a glance:
⚙️ Micron: Record Quarter Delivered
👟 Nike: Turning the Page
🚚 FedEx: Warning Signs
🛳️ Carnival: Sailing Ahead of Schedule
🍪 General Mills: Still Under Pressure

FROM OUR PARTNERS

Snagged helps clients acquire premium, hard-to-obtain digital assets.
Led by Rob Schutz (co-founder and former Chief Growth Officer at Ro), they help companies navigate the opaque and often confusing world of domain names.
They’ve worked with everyone from scrappy founders to public companies, securing deals like Kit.com, Slash.com, Kickstart.com, Bilt.com, World.org, and more.
Snagged offers a free initial assessment to gauge feasibility (budget, owner, etc), then handles research, outreach, negotiation, and transfer—so you don’t end up WhatsApp’ing a domain investor in the UAE at 2am.
Their reputation is top-tier, with endorsements from Garry Tan (Y Combinator), Alexis Ohanian (Reddit, 776), and John Zimmer (Lyft).
Dream domain in mind? Selling a premium one? Or just want to geek out on domains?
Micron saw its May quarter (Q3 FY25) revenue surge 37% Y/Y and 15% Q/Q to $9.3 billion ($450 million beat), with EPS of $1.91 ($0.30 beat) and the highest free cash flow in six years at nearly $2 billion. DRAM (Dynamic Random Access Memory) drove the surge, accounting for 76% of total sales, while HBM (High Bandwidth Memory) revenue jumped almost 50% sequentially, crossing a $6 billion run rate. Data center sales doubled Y/Y, and management confirmed its HBM chips are sold out through 2025.
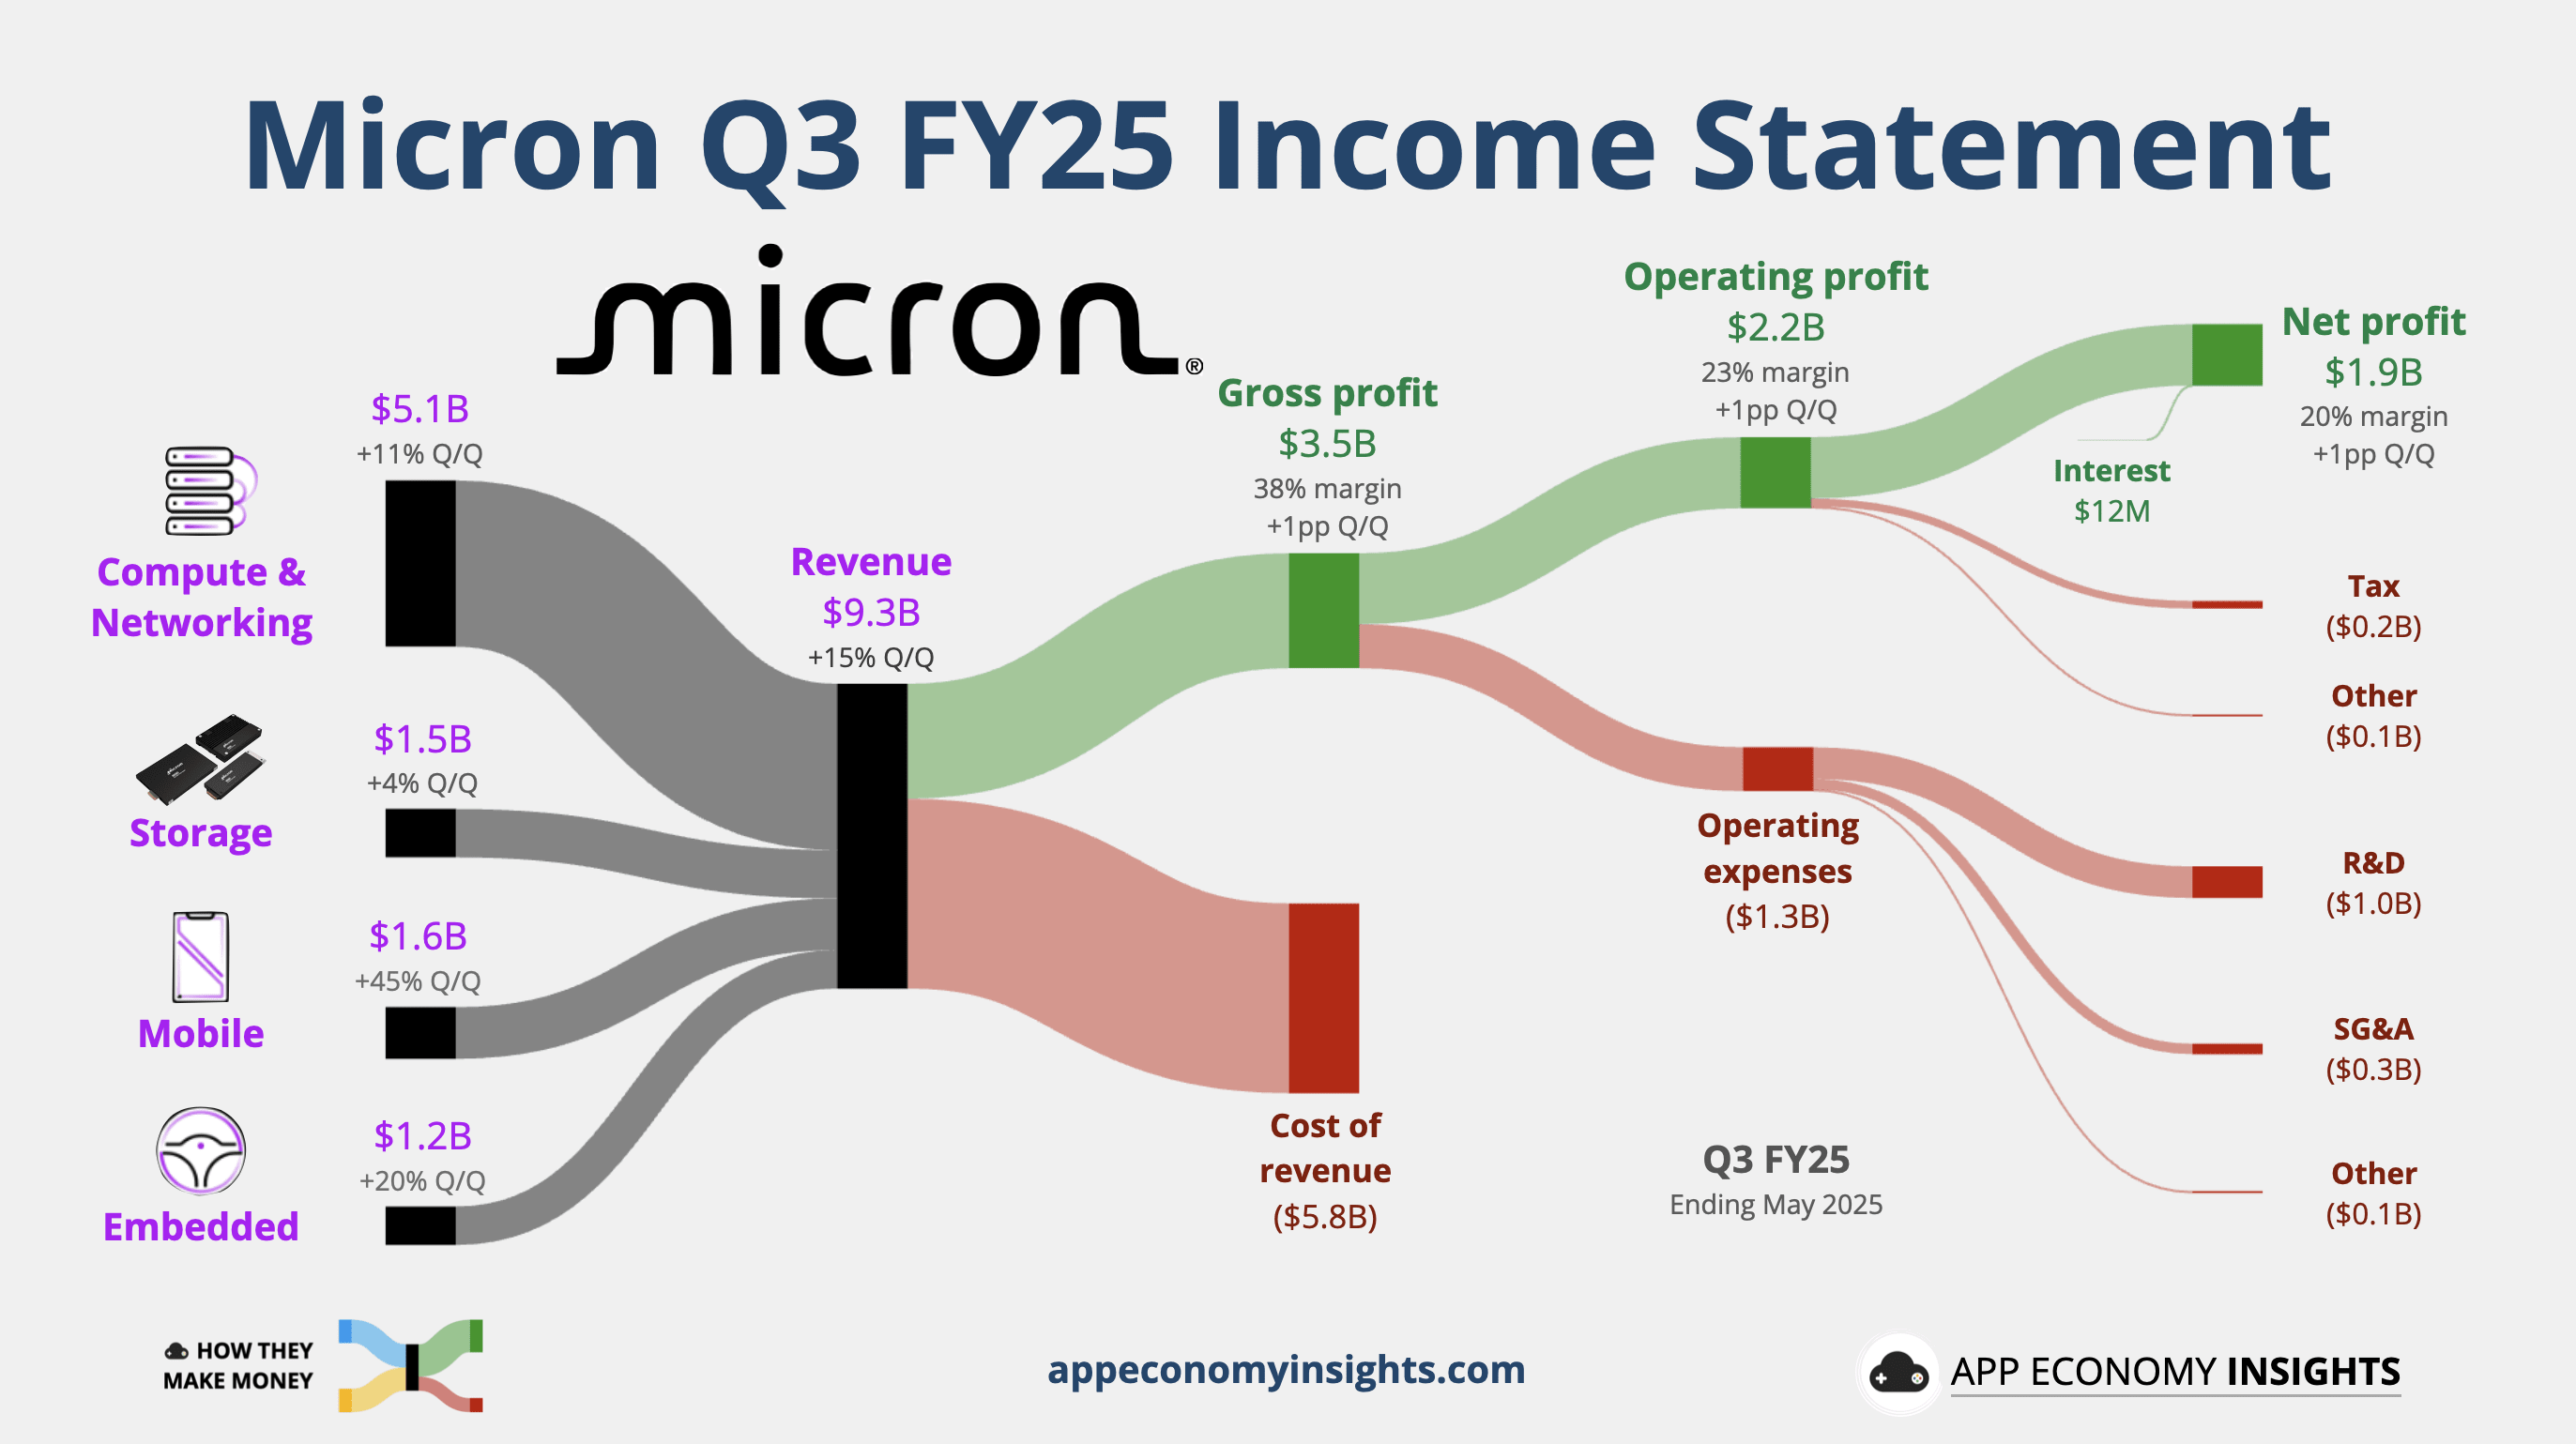
Guidance came in hot: Q4 FY25 revenue is projected at $10.7 billion ($0.8 billion beat) and EPS at $2.50 ($0.47 beat), both well above consensus. Management raised its DRAM bit growth outlook for 2025 to the high teens and expects gross margin to expand to 42%. Analysts cheered the AI momentum but noted that lofty expectations leave little room for upside surprises. Shares fell despite the beat, as the bar keeps rising. The stock rose nearly 50% in the first half of 2025.
Nike’s May quarter results (Q4 FY25) showed signs of stabilization in a difficult turnaround. Revenue fell 12% Y/Y to $11.1 billion ($380 million beat), and gross margin declined 4 points to 40%, better than feared. Nike Direct dropped 14% while wholesale fell 9%, reflecting ongoing weakness in digital and core franchises, but also progress in rebuilding retail relationships. Revenue in Greater China dropped 21% to $1.5 billion, underperforming the rest of the world. EPS came in at $0.14, down 86% Y/Y but ahead of consensus ($0.02 beat).

CEO Elliott Hill pitched a “sport offense” strategy to accelerate the reset: streamlining leadership, creating sport-specific teams, and returning to Amazon with a featured store. The company also announced price hikes and production shifts away from China to combat a looming $1 billion tariff headwind. Encouragingly, performance categories like running and basketball are gaining traction, and the holiday order book is up.
While management expects more margin pressure in the first half of FY26, inventory was flat, and analysts see Q4 as the bottom. With shares rebounding from a 10-year low and sentiment improving, Nike may be lacing up for a long-overdue comeback.
FedEx topped expectations in its May quarter (Q4 FY25) with revenue up 1% Y/Y to $22.2 billion and adjusted EPS of $6.07 ($0.22 beat). Cost cuts from its DRIVE and Network 2.0 programs helped lift margins, with Express improving thanks to higher export volumes and pricing. However, Freight remained weak, and the expiration of the USPS contract weighed on results. Management confirmed another $1 billion in permanent savings for FY26 and plans $4.5 billion in capex, focused on modernizing its network and fleet.
2025-06-27 20:03:04
Welcome to the Free edition of How They Make Money.
Over 200,000 subscribers turn to us for business and investment insights.
In case you missed it:
Revenue is vanity.
Profit can be misleading.
Free cash flow doesn’t lie.
As the late Charlie Munger put it:
“Earnings can be fudged. Cash flow is harder to fake.”
Free cash flow is the money left in the bank after operating the business and keeping it running smoothly. No accounting gimmicks. No paper gains. Just real dollars—ready to be reinvested, returned to shareholders, or used to survive tough times.
And yet, despite its importance, free cash flow is often misunderstood.
In this guide, we’ll break down:
What free cash flow means.
Why it matters more than earnings.
How to calculate it (and where to find it).
What to look for when analyzing FCF.
Examples from real companies.
Key pitfalls and red flags.
Let’s demystify one of the most powerful signals in business analysis.
FROM OUR PARTNERS
Snagged helps clients acquire premium, hard-to-obtain digital assets.
Led by Rob Schutz (co-founder and former Chief Growth Officer at Ro), they help companies navigate the opaque and often confusing world of domain names.
They’ve worked with everyone from scrappy founders to public companies, securing deals like Kit.com, Slash.com, Kickstart.com, Bilt.com, World.org, and more.
Snagged offers a free initial assessment to gauge feasibility (budget, owner, etc), then handles research, outreach, negotiation, and transfer—so you don’t end up WhatsApp’ing a domain investor in the UAE at 2am.
Their reputation is top-tier, with endorsements from Garry Tan (Y Combinator), Alexis Ohanian (Reddit, 776), and John Zimmer (Lyft).
Dream domain in mind? Selling a premium one? Or just want to geek out on domains?
Free cash flow (FCF) is the cash a company generates after covering its core operating expenses (OpEx) and capital expenditures (CapEx).
Sounds like finance jargon?
👉 Check out our free series covering how to analyze financial statements.
That’s where we walk you through the trifecta of finance:
⚖️ Balance Sheet.
📊 Income Statement.
💵 Cash Flow Statement.
In simple terms:
Free Cash Flow = [Cash from Operations – Capital Expenditures]It’s what’s left over after a business pays to run and maintain itself. Actual usable cash.
That’s why many investors treat it as the real bottom line.
Imagine you run a lemonade stand:
You earn $1,000 selling lemonade (Revenue).
You spend $400 on lemons, sugar, and cups (OpEx).
You spend $200 on a new juicer (CapEx).
Your free cash flow is:
[$1,000 – $400 – $200] = $400An asset like a juicer would be depreciated over several years in the income statement, but the cash leaves the bank account all at once.
You won’t find “free cash flow” directly in the financial statements, but you can calculate it easily by checking the cash flow statement in the 10-Q or 10-K filing.
Find Cash Flow from Operations.
Subtract Capital Expenditures (often called “Purchase of property and equipment”).
And voila!
Some companies report it directly. Many don’t. But the math is universal.
Free cash flow may sound like finance jargon, but the math is simple.
Let’s visualize it with Apple’s FY24 free cash flow.
Many of our articles visualize the income statement, which shows the underlying operations: [revenue less expenses] = profit.
But we have to go 2 steps further to analyze the FCF.
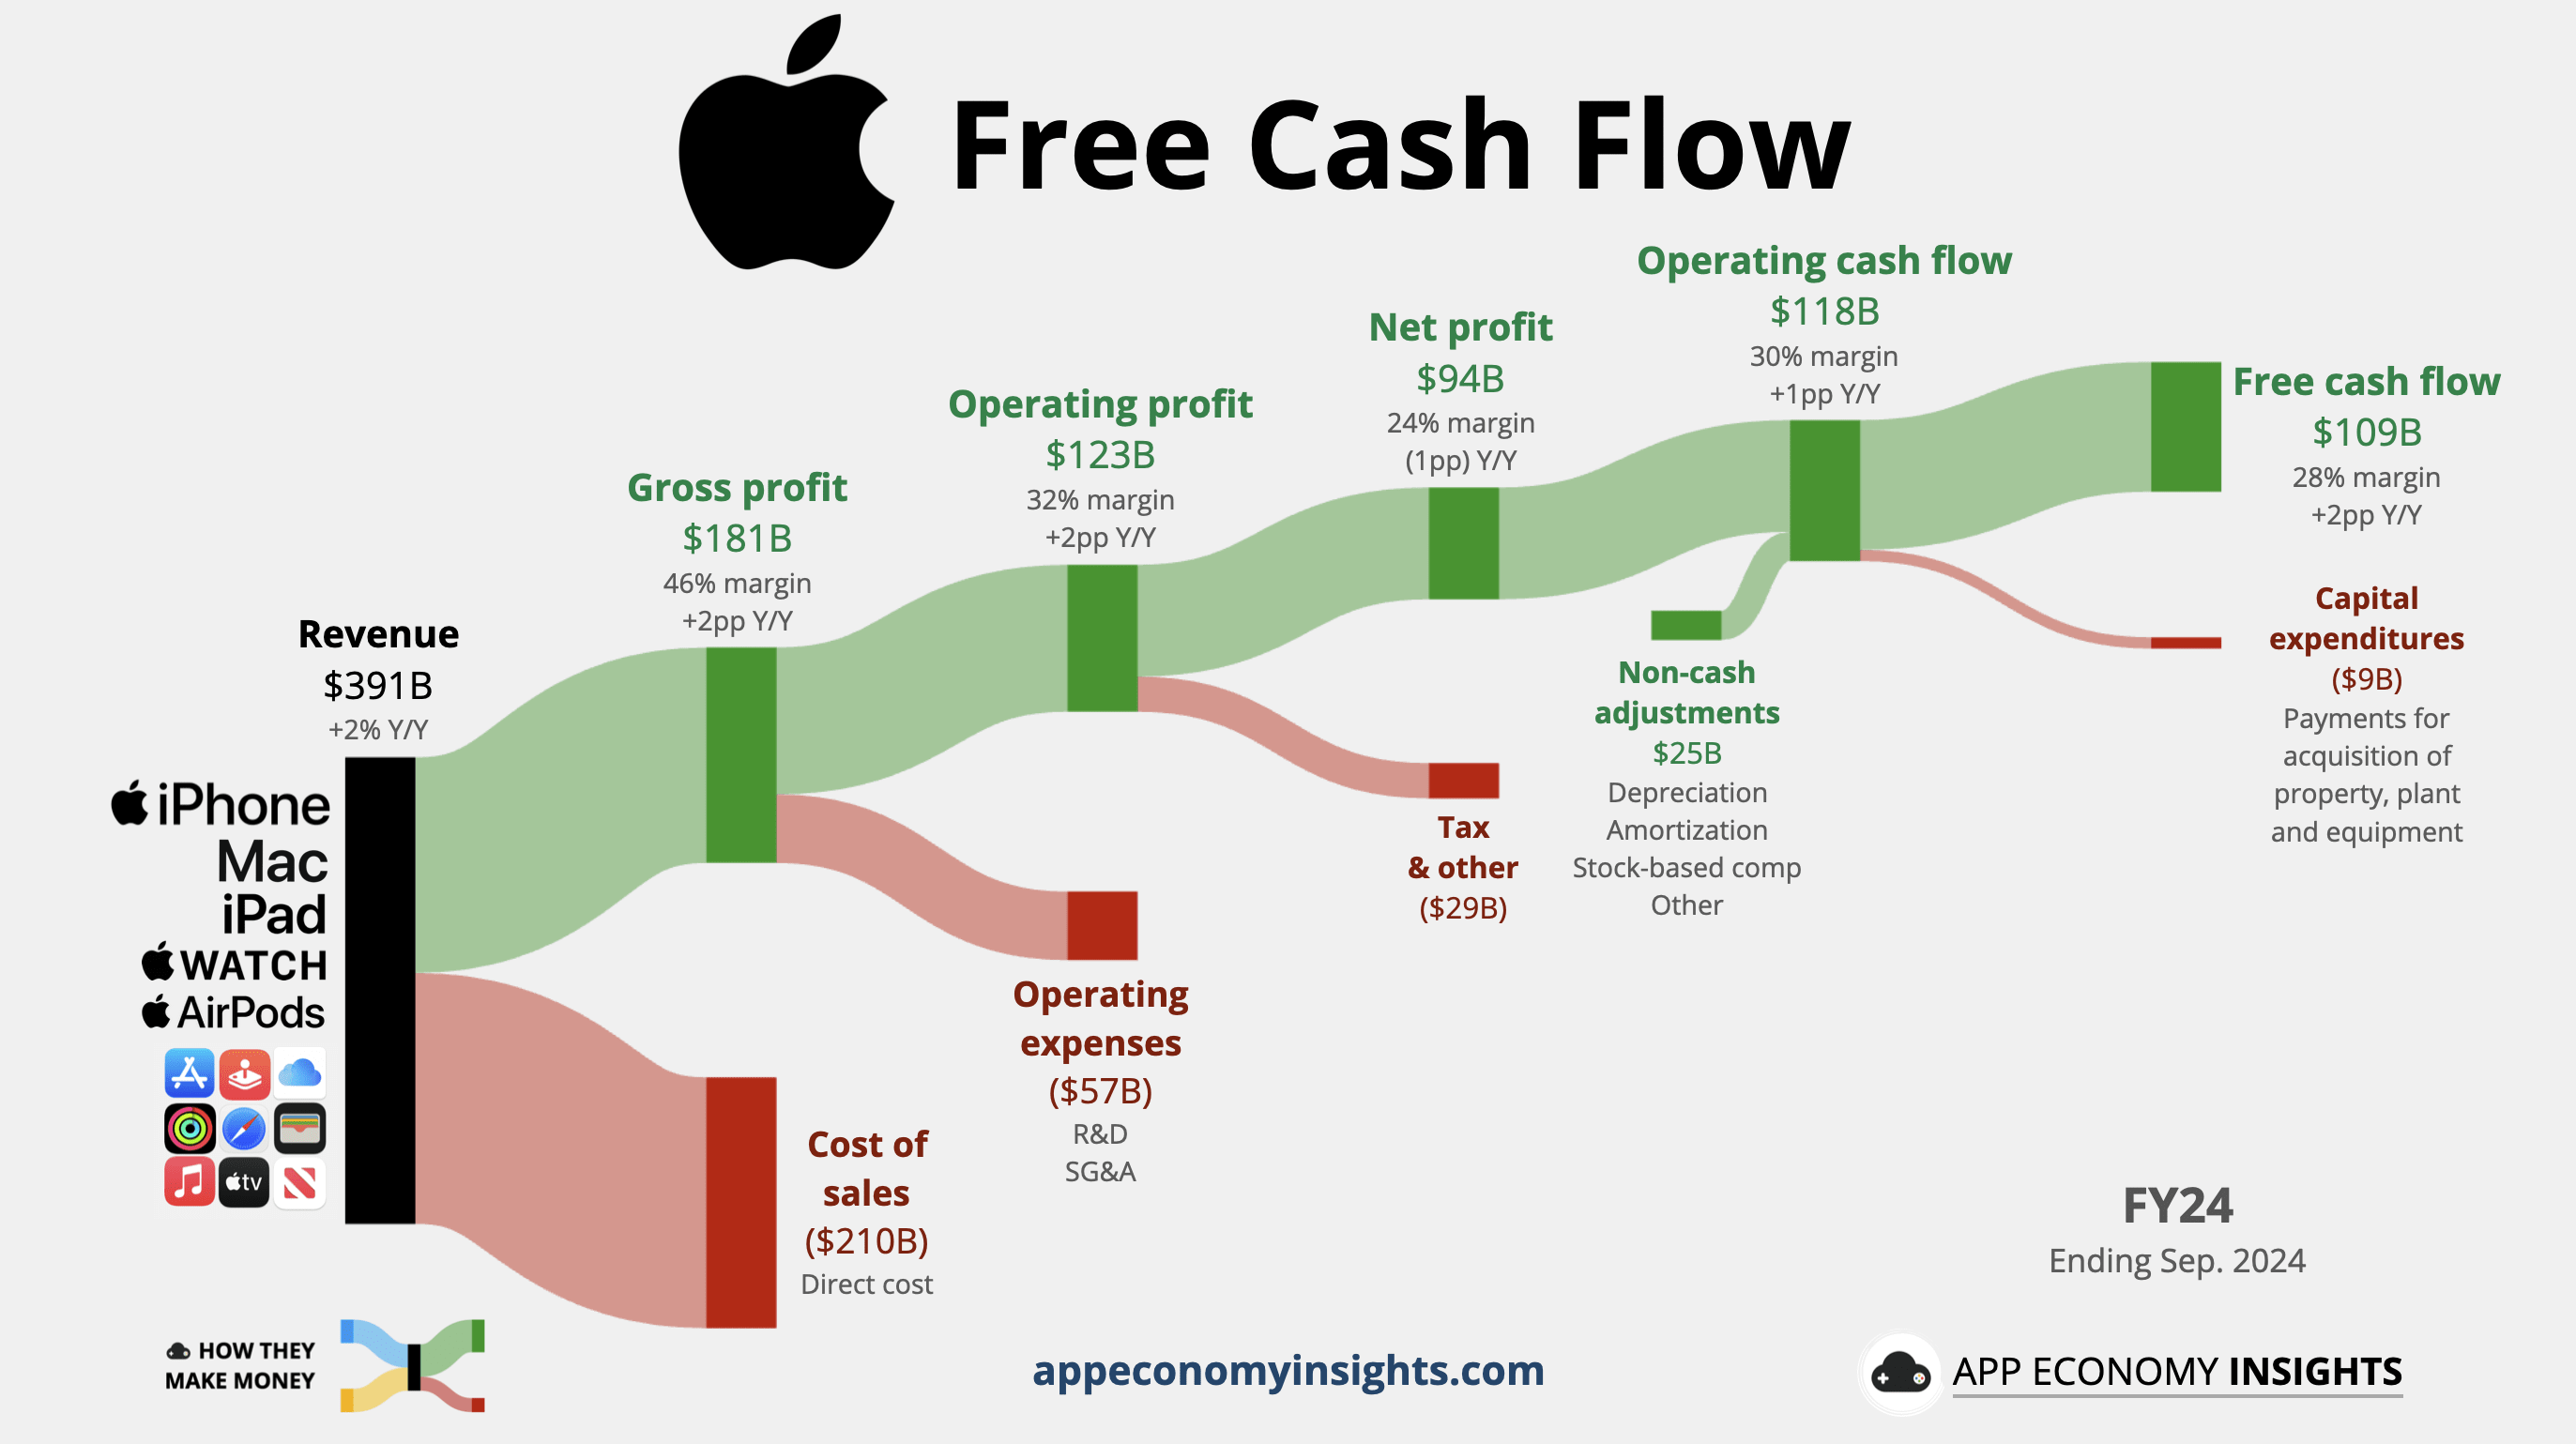
This is the cash a company brings in from its core business—selling products or services. It’s the first major line on the cash flow statement, often called:
Net cash provided by operating activities.
Cash from operations.
Operating cash flow.
It all means the same thing.
We start with the net profit provided at the end of the income statement, and we adjust for non-cash items (like depreciation) and working capital changes (like inventory and receivables).
For Apple in FY24:
Net profit was $94 billion.
It included a mix of non-cash items for a net gain of $25 billion.
Operating cash flow was [$94 billion + $25 billion] = $118 billion.
CapEx is the money spent to maintain or grow the business: buying factories, servers, warehouses, or equipment. This is usually labeled in the cash flow statement as:
Purchase of property, plant, and equipment.
Additions to PP&E.
Apple’s CapEx in FY24 was $9 billion.
Apple’s Free Cash Flow = [$118 billion – $9 billion] = $109 billionAfter running its business and reinvesting in its infrastructure, Apple can use its FCF for stock buybacks, dividends, and more.
Free cash flow is what a company can actually use. It’s the fuel behind every meaningful shareholder action. Without it, a business has no flexibility.
Here’s what strong free cash flow enables:
Want to launch a new product? Open a new data center? Expand globally?
FCF funds the future.
Companies with strong FCF can reinvest aggressively over time, without taking on debt or issuing new shares.
Free cash flow makes shareholder returns possible.
If a company is paying a dividend without FCF to support it, that’s a red flag.
Buybacks? They’re only sustainable if backed by real cash from the business.
Higher interest rates have made debt expensive again. FCF gives companies breathing room, reducing debt and staying resilient in downturns.
Free cash flow is what gives a company control over its destiny.
It creates room to:
Make acquisitions.
Pivot when needed.
Survive tough cycles.
No cash = no control.
Earnings (net income) can be polluted with one-off accounting gains/losses.
Free cash flow is harder to fake.
Depreciation, amortization, and accruals can inflate or deflate earnings.
FCF tells you how much actual money hit the bank.
That’s why many top investors—Buffett included—focus on FCF first, earnings second.
Free cash flow is powerful—but it’s not foolproof.
Here are key pitfalls to keep in mind when analyzing it:
A company might sell off an asset—like real estate or a business unit—and report a spike in cash flow.
That looks good… until next year.
Watch for:
“Proceeds from asset sales” on the cash flow statement.
Unusually high FCF not aligned with operating performance.
Always ask: Is this repeatable?
Sometimes companies slash capital expenditures to boost free cash flow in the short term. It makes the numbers look better, but may starve future growth.
If CapEx suddenly drops with no explanation, dig deeper.
Not all CapEx is equal:
Maintenance keeps the engine running.
Growth builds a new engine.
Some investors adjust FCF using only maintenance CapEx, but those figures are rarely disclosed.
A company might delay payments to suppliers or speed up customer collections to juice operating cash flow. This can temporarily inflate free cash flow, but it’s not sustainable.
Look for big swings in accounts payable or receivable.
Not all negative FCF is bad. Startups and high-growth firms often invest heavily upfront, sacrificing short-term FCF for long-term payoff.
Think Amazon in its early days. Or Tesla.
Instead of punishing negative FCF, ask:
Is the business reinvesting with discipline?
Does unit economics make sense?
Free cash flow looks great—until you realize the company paid employees in stock. This is particularly true with US tech companies. That cash didn’t leave the bank account… but your ownership got diluted. We demystify stock-based comp here.
Compare FCF within business models. A software company with low CapEx will naturally generate more FCF than a factory-heavy business.
Don’t always assume more FCF = better business.
Context is everything.
Free cash flow tells you what just happened, not what’s coming next.
It reflects decisions made quarters or years ago. A company might post record FCF today… right before demand softens, costs surge, or competition catches up.
Don’t mistake strong FCF for guaranteed momentum.
Always ask: Is this sustainable? What’s changing under the hood?
That’s why you need to pair FCF analysis with forward-looking signals:
New product cycles.
Capital allocation plans.
Customer retention trends.
Competitive landscape shifts.
Great FCF today is nice.
But great FCF tomorrow is what you’re investing in.
Let’s see how free cash flow plays out in the real world.
Here’s a look at the FCF annual trend of the Magnificent 7 from 2009 to 2024. The stock price appreciation of these stocks has generally followed FCF, except for Tesla.
While NVIDIA looked like Tesla just two years ago, its FCF has surged above Meta and is catching up to Microsoft and Google.

While profitable, Amazon reinvests heavily in logistics, cloud infrastructure, and data centers. Its FCF margin is relatively low (6%), but it reflects long-term strategic bets like AI innovation, Project Kuiper (Starlink competitor), and integrated healthcare.
Following the global pandemic, Amazon invested heavily in the regionalization of its fulfillment centers, resulting in faster and cheaper deliveries, improving margins, and expanding the company’s moat in the process. But FCF took a beating in 2021 and 2022 as a result.
🔁 Short-term pain can lead to long-term gains.

For years, Netflix was deep in the red, burning billions in free cash flow to fund its original content library and international expansion. Today, we all know it turned out to be a prescient strategic decision to dominate in the streaming space.
In the post-pandemic era, the script flipped. With production efficiency, pricing power, and global scale, Netflix has now turned into a cash-printing machine. A new ad tier and password crackdown initiative turned it into overdrive.
Netflix shows that negative FCF isn’t always a negative signal—it can be a bold, long-term strategy. The key is whether the investments eventually create durable operating leverage.
🎬 A decade of investment is now paying off.

So you’re looking at a company’s free cash flow. Now what?
Here’s how to separate the signal from the noise:
Is free cash flow growing consistently?
One great year means nothing if declines follow.
Look for a multi-year trend that shows durable growth.
How efficient is the company at converting revenue into free cash?
FCF Margin = [Free Cash Flow ÷ Revenue]20%+ is excellent (common in software and services).
5–15% is solid, depending on the industry.
Negative? It might be due to strategic investments or a warning sign.
Does the company convert its profit into cash?
Free Cash Flow ÷ Net Income
The closer to 100%, the better.
A big gap between reported profits and actual cash? You might need to look closer.
How much free cash flow is available to each shareholder?
FCF per share = [FCF ÷ Shares outstanding]Unlike Earnings Per Share (EPS), which can be inflated by non-cash accounting, FCF per share reflects real economic value per share.
It’s especially useful when evaluating shareholder yield (dividends + buybacks).
Is the stock cheap or expensive relative to its free cash flow?
P/FCF = [Market Cap ÷ Free Cash Flow]Caveat: P/FCF can be misleading if FCF is temporarily inflated or depressed.
Remember, investing is always about looking forward, not backward. It’s best to think in terms of free cash margin at maturity and apply it to future revenue expected.
A low P/FCF might mean a company is in decline.
Low FCF margins can be explained by the specific industry.
A negative FCF might be part of a deliberate growth strategy.
Free cash flow is powerful, but it’s not a shortcut.
It’s a lens, not a crystal ball.
Free cash flow is one of the sharpest signals in business analysis.
It’s the fuel that powers everything from reinvestment to shareholder returns.
Here’s what to remember:
It’s not accounting magic. It’s real, spendable cash.
It’s not always obvious. You have to calculate it and put it in context.
It’s not infallible. Always ask if the number is repeatable and sustainable.
Companies with durable, growing free cash flow tend to have pricing power, efficient operations, and optionality in good times and bad.
That’s what long-term investors should care about.
Because at the end of the day, cash is king.
That’s it for today!
Stay healthy and invest on!
Disclosure: I am long AAPL, AMZN, GOOG, META, NFLX, NVDA, and TSLA in App Economy Portfolio. I share my ratings (BUY, SELL, or HOLD) with App Economy Portfolio members.
Author's Note (Bertrand here 👋🏼): The views and opinions expressed in this newsletter are solely my own and should not be considered financial advice or any other organization's views.