2025-09-26 08:00:00
I’ve recently started building a POC of a Redis RESP3 Wire Compatible Key/Value Database built on FoundationDB with @calabro.io and though it’s rather early, it’s already spawned a fun distributed systems problem that I thought would be interesting to share.
Previously I’ve written about how I implemented a Graph DB via Roaring Bitmaps, representing relations as a bidirectional pair of sets.
To support such use-cases in this new database, we’d like to represent sets of keys such that you can perform boolean operations on them (intersection, union, difference) relatively quickly even for very large sets (with millions of members).
In the original Graph DB, we were representing user DID strings as uint32 UIDs to allow us to store millions of edge lists in very little space (e.g. the set of users who follow bsky.app) while being able to perform boolean operations between lists quickly (using Roaring Bitmaps’ parallel boolean operators).
Since we were graphing follows, blocks, and other such User-to-User relationships, there was a practical maximum for the total number of user IDs in the low billions.
We’ve continued exploring objects and relationships we’d like to represent as a Graph, and have realized that if we wanted to store e.g. the URIs of all posts a user has liked so we can intersect it with other users’ likes, we’re going to need a bigger keyspace!
There are well over 15 Billion records in the AT Proto Ecosystem, each with a unique AT URI!
Now our desired keyspace is much larger than can be represented by uint32 values and so we need to expand to uint64.
Easy enough, let’s use the uint64 flavor of Roaring Bitmaps and simply intern URIs and User DIDs as uint64s, problem solved, right?
Not quite…
The AT Proto Firehose has hit historic peak traffic of over 1,500 evt/sec.
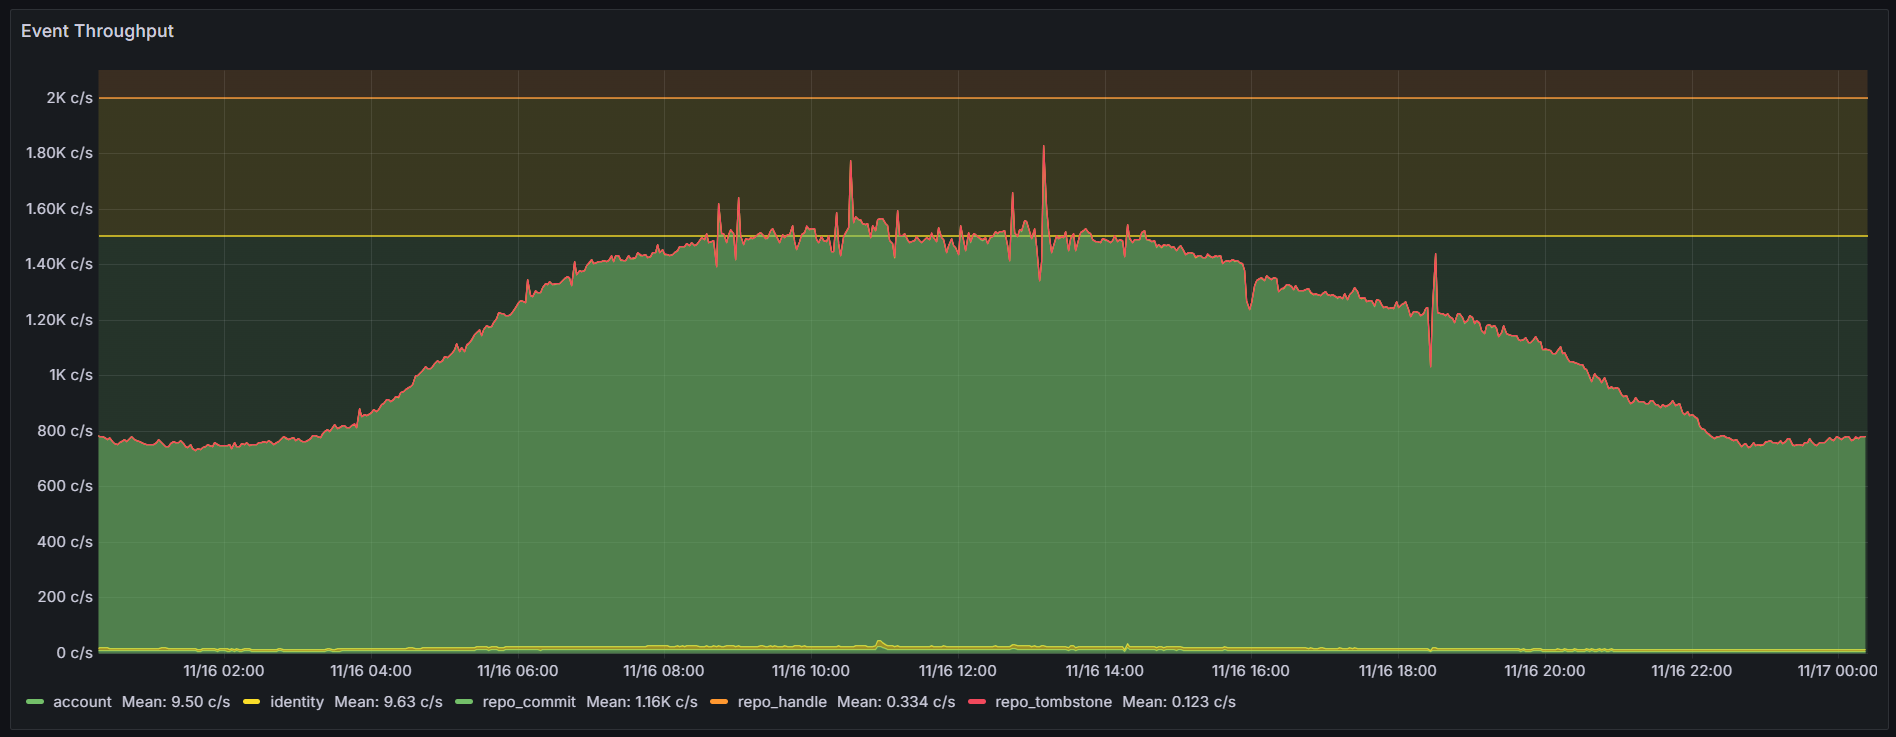
We want to design a system that will handle many times more scale than we’ve ever seen in reality.
This means designing for 10x or 100x would require us to be able to intern 15k to 150k new URIs per second into uint64 integers.
Sounds easy enough, what’s the holdup?
Well, in FoundationDB we’re able to use Transactions to do things like atomically increment a sequence safely when many other threads may be trying to do the same thing.
This is simple enough to do in Go, we can just toss together a little helper function to acquire a new UID for our string:
func (s *server) allocateNewUID(span trace.Span, tx fdb.Transaction) (uint64, error) {
	var newUID uint64
	val, err := tx.Get(fdb.Key("last_uid")).Get()
	if err != nil {
		return 0, return fmt.Errorf("failed to get last UID: %w", err)
	}
	if len(val) == 0 {
		newUID = 1 // start from 1
	} else {
		lastUID, err := strconv.ParseUint(string(val), 10, 64)
		if err != nil {
			return 0, return fmt.Errorf("failed to parse last UID: %w", err)
		}
		newUID = lastUID + 1
	}

	tx.Set(fdb.Key("last_uid"), []byte(strconv.FormatUint(newUID, 10)))
	return newUID, nil
}
This function gets called from a fdb.Transaction which gets assigned a Transaction ID, then stages its changes, then tries to commit them.
In FoundationDB, if your transaction is reading or modifying data written to by a different Transaction that finishes while you’re in-progress, your Transaction is thrown out and must be retried.
For our UID assignment use-case, this is pretty problematic. We want to assign hundreds of thousands of new UIDs per second but if they’re all modifying the same key, concurrent transactions will constantly run into contention on the same data and will be forced to retry over and over again. This problem gets worse the more concurrent transactions you have trying to read from or write to the same key.
Even if we stick to sequential access, if it takes ~5-10ms to assign a UID, we can only assign ~100-200 UIDs per second, nowhere near the throughput we need to support.
How can we get past this problem and allow us to give strings unique uint64 UIDs in a high throughput and highly concurrent manner?
xxHash
My first attempt to solve this problem was to try something that required no coordination and hash the string keys into uint64s using xxHash.
xxHash is a non-cryptographic hash algorithm that supports incredibly high throughput (dozens of GB/sec) and can produce 64 bit unsigned integer hashes of strings trivially.
Implementing this would look something like:
uint64 UID to see if we’ve already assigned it to a string
While the uint64 keyspace is plenty large for our needs assuming we distribute evenly among the whole space, using a hashing algorithm with no coordination means there’s room for collisions and thus we’d need some additional logic (potentially by bucketing the keys somehow).
Consulting the Birthday Problem we can see that a keyspace with 64 bit hashes has a >50% chance of containing a single collision when we have only ~5 billion keys in the set! That’s barely more keys than we can cram into a uint32 and definitely won’t suffice for the number of keys we expect to be storing!
So, xxHash, while nice and coordination-free is probably not going to be the solution we need.
What else can we do?
Incrementing one sequence is clearly not an option because we can only increment a single sequence ~100-200 times per second, but what if we instead had more than one sequence?
Roaring Bitmaps managed to make highly efficient bitmap representations by breaking up a uint32 keyspace into a uint16-wide set of uint16-wide keyspaces. Can we do something similar here?
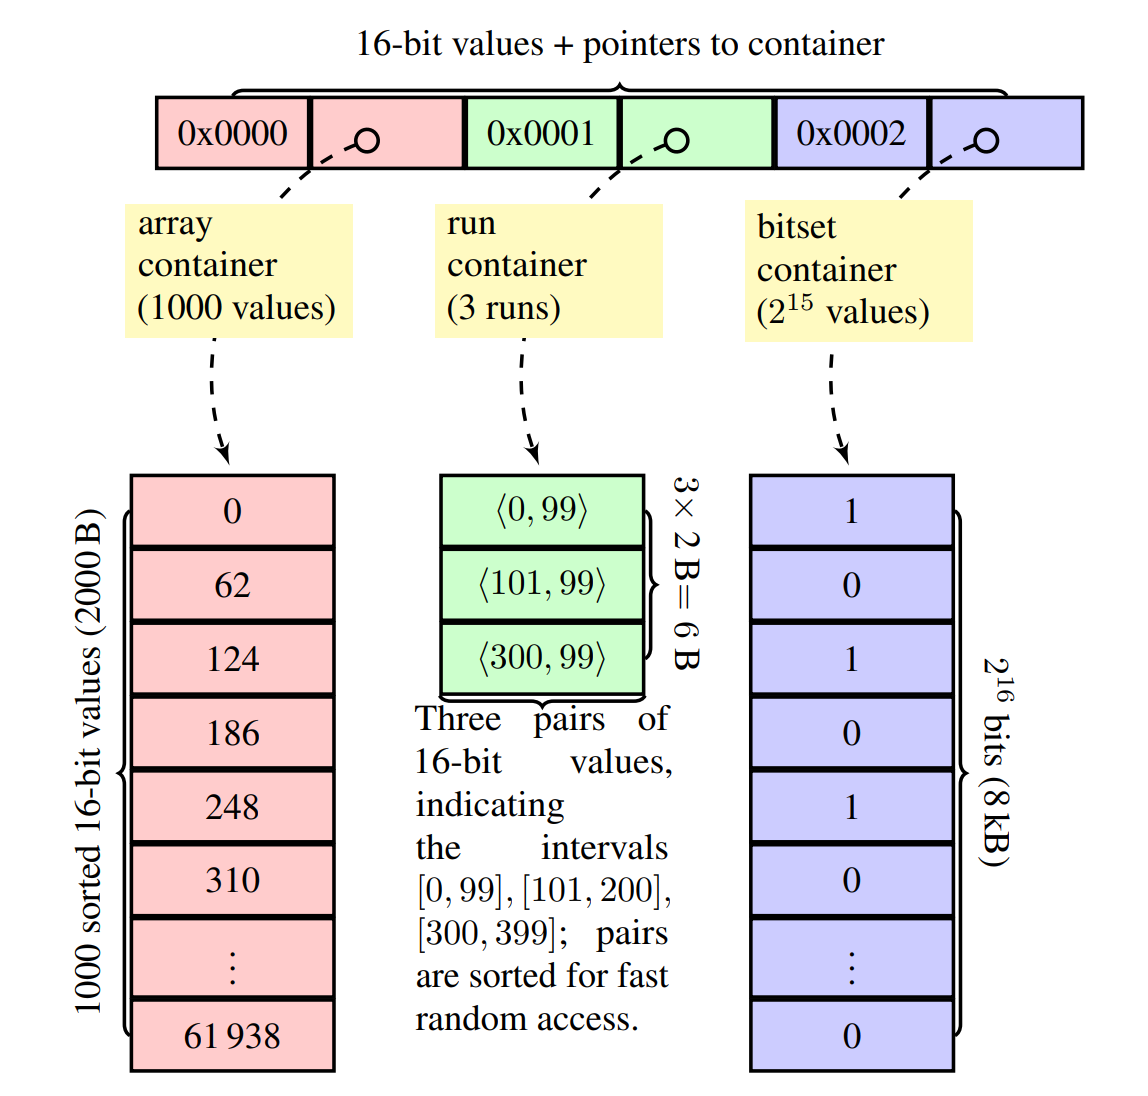
Here’s an idea, what if we had just over 4 billion difference sequences and just picked one at random when we needed to assign a UID?
Since we’re constructing our UIDs as a uint64, we can split the full UID into a pair of uint32s where the most-significant-bits are used to identify the sequence ID and the least-significant-bits are used to identify the value assigned to the UID within the sequence.

So in our implementation, we get ~4.3 Billion sequence IDs that each have ~4.3 Billion incrementing values.
As an example, if we were to randomly select Sequence ID 37 and then we increment that sequence to the value 5, we’d assemble the ID as 37<<32 + 5 which looks like 158,913,789,952 + 5 -> 158,913,789,957. Looking at the next Seuqence ID, we’d see 38 which, when left shifted by 32 gives us 163,208,757,248. You can see there’s a gap of ~4.3 billion values between the first UID assigned by each Sequence ID.
Assuming we can increment a single sequence ~100 times per second with contention, we’re able to mint 430 Billion new UIDs per second without locking up (assuming the cluster can keep up).
Storing ~4.3 billion sequences may be a bit expensive, but thankfully this strategy can scale up and down by picking a larger or smaller prefix size. If we only wanted to store say, ~16k sequences, we can pick a 14 bit prefix instead of a 32 bit prefix and then use a 50 bit sequence number. That spreads the load across 2^14 sequence IDs and significantly reduces storage requirements for Sequences.
What does this look like in code? Well, it’s honestly not very complex!
const uidSequencePrefix  = "uid_sequence/"

func (s *server) allocateNewUID(tx fdb.Transaction) (uint64, error) {
	// sequenceNum is the random uint32 sequence we are using for this allocation
	var sequenceNum uint32
	var sequenceKey string

	// assignedUID is the uint32 within the sequence we will assign
	var assignedUID uint32

	// Try up to 5 times to find a sequence that is not exhausted
	for range 5 {
		// Pick a random uint32 as the sequence we will be using for this UID
		sequenceNum = rand.Uint32()
		sequenceKey = fmt.Sprintf("%s%d", uidSequencePrefix, sequenceNum)

		val, err := tx.Get(fdb.Key(sequenceKey)).Get()
		if err != nil {
			return 0, fmt.Errorf("failed to get last UID: %w", err)
		}
		if len(val) == 0 {
			assignedUID = 1 // Start each sequence at 1
		} else {
			lastUID, err := strconv.ParseUint(string(val), 10, 32)
			if err != nil {
				return 0, fmt.Errorf("failed to parse last UID: %w", err)
			}

			// If we have exhausted this sequence, pick a new random sequence
			if lastUID >= 0xFFFFFFFF {
				continue
			}

			assignedUID = uint32(lastUID) + 1
		}
	}

	// If we failed to find a sequence after 5 tries, return an error
	if assignedUID == 0 {
		return 0, fmt.Errorf("failed to allocate new UID after 5 attempts")
	}

	// Assemble the 64-bit UID from the sequence ID and assigned UID
	newUID := (uint64(sequenceNum) << 32) | uint64(assignedUID)

	// Store the assigned UID back to the sequence key for the next allocation
	tx.Set(fdb.Key(sequenceKey), []byte(strconv.FormatUint(uint64(assignedUID), 10)))

	// Return the full 64-bit UID
	return newUID, nil
}
And there we go! We can now intern billions of strings per second with little to no contention in a distributed system while completely avoiding collisions and making full use of our keyspace!
Often times when designing distributed systems, patterns and strategies you see in seemingly unrelated libraries can inspire an elegant solution to the problem at hand.
In the case of distributed, high-throughput string interning, horizontal scaling can be achieved by breaking up one large keyspace that requires strict coordination into billions of smaller keyspaces that can be randomly load-balanced across.
Both patterns used in this technique are present elsewhere:
This is one of my favorite parts of growing as an engineer: the more systems and strategies you familiarize yourself with, the more material you have to draw from when designing something new.
A bit of personal news for y’all if you made it this far.
Today is my last day as a member of the Bluesky team!
The past 2+ years building out Bluesky’s Infrastructure and Platform team and scaling Bluesky from 100,000 -> 40,000,000 users have been the most intense and rewarding years of my life.
I don’t have the words to express how much I’ve valued my time on the team and how much I care for the people I’ve worked with in what feels like a decade of real time.
I’ve got some new adventures ahead and am excited to be embarking on a new journey within the next month (still building large-scale infrastructure, don’t worry).
I plan to continue being involved in the AT Proto Community and to contribute to some cool projects other folks on the Bluesky team are working on from the FOSS space (like KVDB).
To the team, I wish you all the best and will dearly miss getting to work with you all every day, but nothing lasts forever and I will always cherish the time I got to spend building an incredible platform with incredible people.
If you’re interested in joining a world-class team doing important work, check out Bluesky’s open job listings here.
There should be a new role opening up for a seasoned Go Engineer on the Platform team soon!
2025-02-19 08:00:00
Often when designing systems, we aim for perfection in things like consistency of data, availability, latency, and more.
The hardest part of system design is that it’s difficult (if not impossible) to design systems that have perfect consistency, perfect availability, incredibly low latency, and incredibly high throughput, all at the same time.
Instead, when we approach system design, it’s best to treat each of these properties as points on different axes that we balance to find the “right fit” for the application we’re supporting.
I recently made some major tradeoffs in the design of Bluesky’s Following Feed/Timeline to improve the performance of writes at the cost of consistency in a way that doesn’t negatively affect users but reduced P99s by over 96%.
When you make a post on Bluesky, your post is indexed by our systems and persisted to a database where we can fetch it to hydrate and serve in API responses.
Additionally, a reference to your post is “fanned out” to your followers so they can see it in their Timelines.
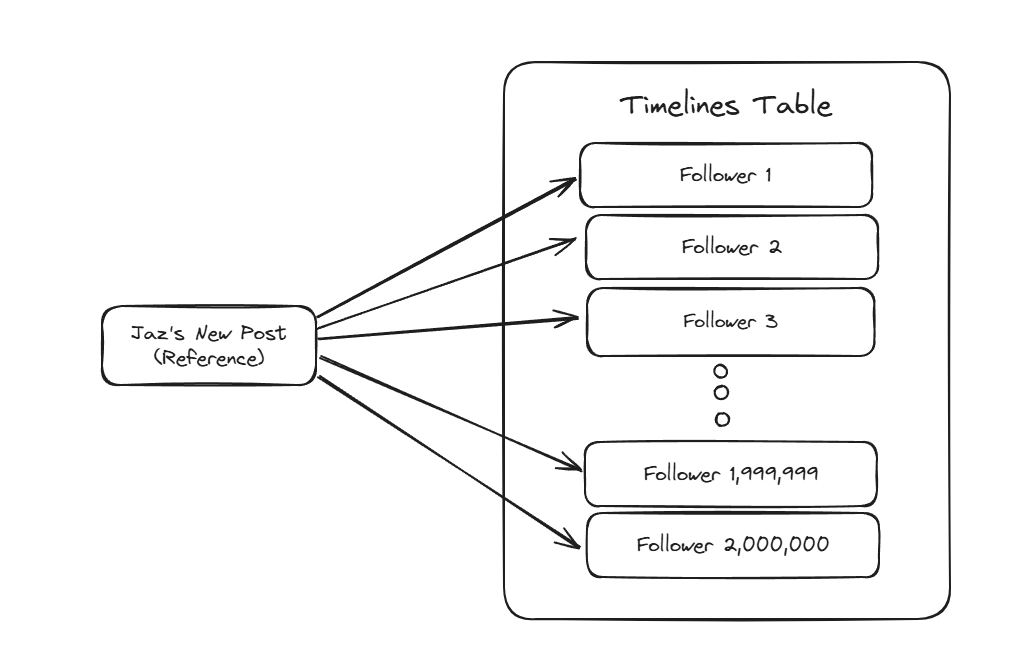
This process involves looking up all of your followers, then inserting a new row into each of their Timeline tables in reverse chronological order with a reference to your post.
When a user loads their Timeline, we fetch a page of post references and then hydrate the posts/actors concurrently to quickly build an API response and let them see the latest content from people they follow.
The Timelines table is sharded by user. This means each user gets their own Timeline partition, randomly distributed among shards of our horizontally scalable database (ScyllaDB), replicated across multiple shards for high availability.
Timelines are regularly trimmed when written to, keeping them near a target length and dropping older post references to conserve space.
Bluesky currently has around 32 Million Users and our Timelines database is broken into hundreds of shards.
To support millions of partitions on such a small number of shards, each user’s Timeline partition is colocated with tens of thousands of other users’ Timelines.
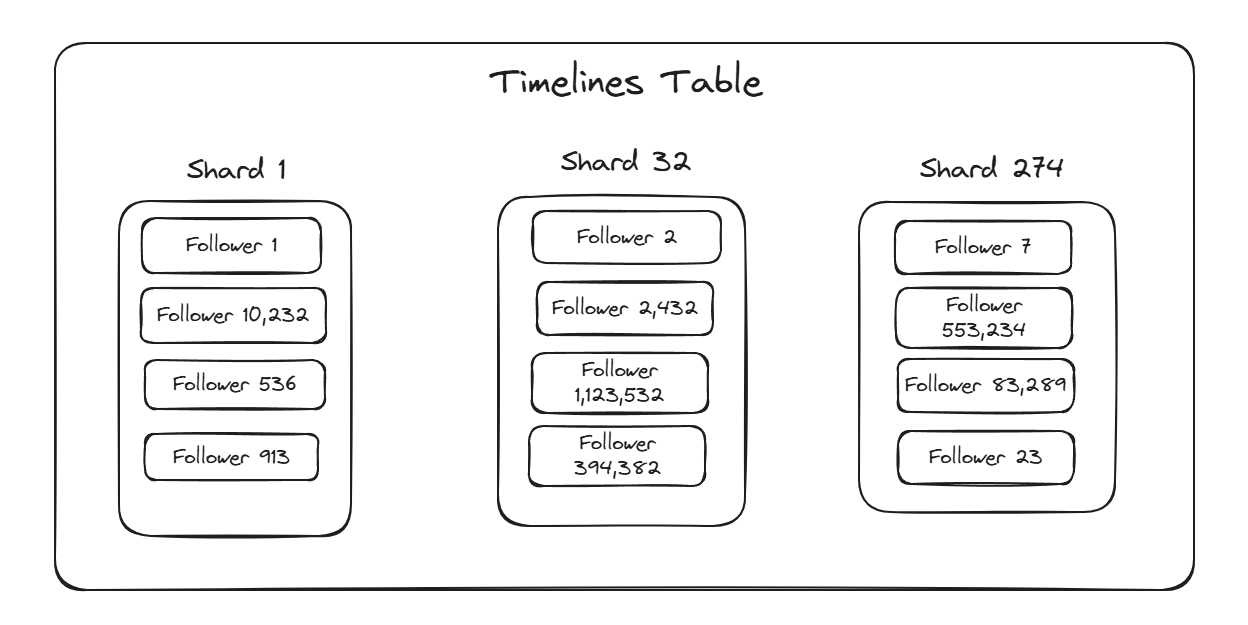
Under normal circumstances with all users behaving well, this doesn’t present a problem as the work of an individual Timeline is small enough that a shard can handle the work of tens of thousands of them without being heavily taxed.
Unfortunately, with a large number of users, some of them will do abnormal things like… well… following hundreds of thousands of other users.
Generally, this can be dealt with via policy and moderation to prevent abusive users from causing outsized load on systems, but these processes take time and can be imperfect.
When a user follows hundreds of thousands of others, their Timeline becomes hyperactive with writes and trimming occurring at massively elevated rates.
This load slows down the individual operations to the user’s Timeline, which is fine for the bad behaving user, but causes problems to the tens of thousands of other users sharing a shard with them.
We typically call this situation a “Hot Shard”: where some resident of a shard has “hot” data that is being written to or read from at much higher rates than others. Since the data on the shard is only replicated a few times, we can’t effectively leverage the horizontal scale of our database to process all this additional work.
Instead, the “Hot Shard” ends up spending so much time doing work for a single partition that operations to the colocated partitions slow down as well.

Returning to our Fanout process, let’s consider the case of Fanout for a user followed by 2,000,000 other users.
Under normal circumstances, writing to a single Timeline takes an average of ~600 microseconds. If we sequentially write to the Timelines of our user’s followers, we’ll be sitting around for 20 minutes at best to Fanout this post.
If instead we concurrently Fanout to 1,000 Timelines at once, we can complete this Fanout job in ~1.2 seconds.
That sounds great, except it oversimplifies an important property of systems: tail latencies.
The average latency of a write is ~600 microseconds, but some writes take much less time and some take much more. In fact, the P99 latency of writes to the Timelines cluster can be as high as 15 milliseconds!
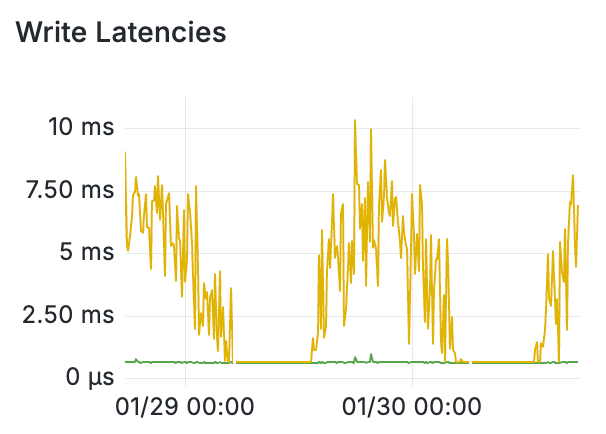
What does this mean for our Fanout? Well, if we concurrently write to 1,000 Timelines at once, statistically we’ll see 10 writes as slow as or slower than 15 milliseconds.
In the case of timelines, each “page” of followers is 10,000 users large and each “page” must be fanned out before we fetch the next page.
This means that our slowest writes will hold up the fetching and Fanout of the next page. How does this affect our expected Fanout time?
Each “page” will have ~100 writes as slow as or slower than the P99 latency. If we get unlucky, they could all stack up on a single routine and end up slowing down a single page of Fanout to 1.5 seconds.
In the worst case, for our 2,000,000 Follower celebrity, their post Fanout could end up taking as long as 5 minutes!
That’s not even considering P99.9 and P99.99 latencies which could end up being >1 second, which could leave us waiting tens of minutes for our Fanout job.
Now imagine how bad this would be for a user with 20,000,000+ Followers!
So, how do we fix the problem? By embracing imperfection, of course!
Imagine a user who follows hundreds of thousands of others. Their Timeline is being written to hundreds of times a second, moving so fast it would be humanly impossible to keep up with the entirety of their Timeline even if it was their full-time job.
For a given user, there’s a threshold beyond which it is unreasonable for them to be able to keep up with their Timeline. Beyond this point, they likely consume content through various other feeds and do not primarily use their Following Feed.
Additionally, beyond this point, it is reasonable for us to not necessarily have a perfect chronology of everything posted by the many thousands of users they follow, but provide enough content that the Timeline always has something new.
Note in this case I’m using the term “reasonable” to loosely convey that as a social media service, there must be a limit to the amount of work we are expected to do for a single user.
What if we introduce a mechanism to reduce the correctness of a Timeline such that there is a limit to the amount of work a single Timeline can place on a DB shard.
We can assert a reasonable limit for the number of follows a user should have to have a healthy and active Timeline, then increase the “lossiness” of their Timeline the further past that limit they go.
A loss_factor can be defined as min(reasonable_limit/num_follows, 1) and can be used to probabilistically drop writes to a Timeline to prevent hot shards.
Just before writing a page in Fanout, we can generate a random float between 0 and 1, then compare it to the loss_factor of each user in the page. If the user’s loss_factor is smaller than the generated float, we filter the user out of the page and don’t write to their Timeline.
Now, users all have the same number of “follows worth” of Fanout. For example with a reasonable_limit of 2,000, a user who follows 4,000 others will have a loss_factor of 0.5 meaning half the writes to their Timeline will get dropped. For a user following 8,000 others, their loss factor of 0.25 will drop 75% of writes to their Timeline.
Thus, each user has a effective ceiling on the amount of Fanout work done for their Timeline.
By specifying the limits of reasonable user behavior and embracing imperfection for users who go beyond it, we can continue to provide service that meets the expectations of users without sacrificing scalability of the system.
We write to Timelines at a rate of more than one million times a second during the busy parts of the day. Looking up the number of follows of a given user before fanning out to them would require more than one million additional reads per second to our primary database cluster. This additional load would not be well received by our database and the additional cost wouldn’t be worth the payoff for faster Timeline Fanout.
Instead, we implemented an approach that caches high-follow accounts in a Redis sorted set, then each instance of our Fanout service loads an updated version of the set into memory every 30 seconds.
This allows us to perform lookups of follow counts for high-follow accounts millions of times per second per Fanount service instance.
By caching values which don’t need to be perfect to function correctly in this case, we can once again embrace imperfection in the system to improve performance and scalability without compromising the function of the service.
We implemented Lossy Timelines a few weeks ago on our production systems and saw a dramatic reduction in hot shards on the Timelines database clusters.
In fact, there now appear to be no hot shards in the cluster at all, and the P99 of a page of Fanout work has been reduced by over 90%.
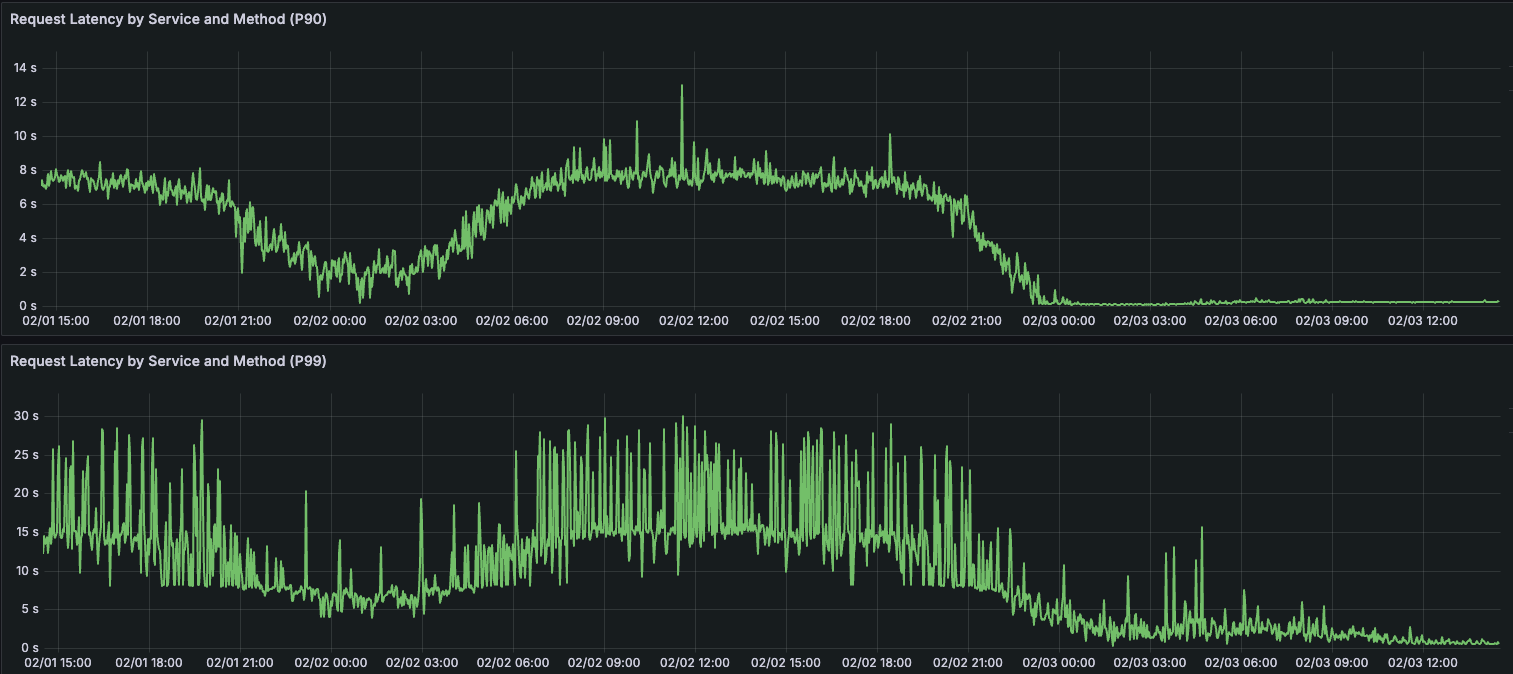
Additionally, with the reduction in write P99s, the P99 duration for a full post Fanout has been reduced by over 96%. Jobs that used to take 5-10 minutes for large accounts now take <10 seconds.


Knowing where it’s okay to be imperfect lets you trade consistency for other desirable aspects of your systems and scale ever higher.
There are plenty of other places for improvement in our Timelines architecture, but this step was a big one towards improving throughput and scalability of Bluesky’s Timelines.
If you’re interested in these sorts of problems and would like to help us build the core data services that power Bluesky, check out this job listing.
If you’re interested in other open positions at Bluesky, you can find them here.
2024-09-24 08:00:00
Bluesky recently saw a massive spike in activity in response to Brazil’s ban of Twitter.
As a result, the AT Proto event firehose provided by Bluesky’s Relay at bsky.network has increased in volume by a huge amount. The average event rate during this surge increased by ~1,300%.
Before this new surge in activity, the firehose would produce around 24 GB/day of traffic. After the surge, this volume jumped to over 232 GB/day!

Keeping up with the full, verified firehose quickly became less practical on cheap cloud infrastructure with metered bandwidth.
To help reduce the burden of operating bots, feed generators, labelers, and other non-verifying AT Proto services, I built Jetstream as an alternative, lightweight, filterable JSON firehose for AT Proto.
The AT Proto firehose is a mechanism used to keep verified, fully synced copies of the repos of all users.
Since repos are represented as Merkle Search Trees, each firehose event contains an update to the user’s MST which includes all the changed blocks (nodes in the path from the root to the modified leaf). The root of this path is signed by the repo owner, and a consumer can keep their copy of the repo’s MST up-to-date by applying the diff in the event.
For a more in-depth explanation of how Merkle Trees are constructed, check out this explainer.
Practically, this means that for every small JSON record added to a repo, we also send along some number of MST blocks (which are content-addressed hashes and thus very information-dense) that are mostly useful for consumers attempting to keep a fully synced, verified copy of the repo.
You can think of this as the difference between cloning a git repo v.s. just grabbing the latest version of the files without the .git folder. In this case, the firehose effectively streams the diffs for the repository with commits, signatures, and metadata, which is inherently heavier than a point-in-time checkout of the repo.
Because firehose events with repo updates are signed by the repo owner, they allow a consumer to process events from any operator without having to trust the messenger.
This is the “Authenticated” part of the Authenticated Transfer (AT) Protocol and is crucial to the correct functioning of the network.
That being said, of the hundreds of consumers of Bluesky’s production Relay, >90% of them are building feeds, bots, and other tools that don’t keep full copies of the entire network and don’t verify MST operations at all.
For these consumers, all they actually process is the JSON records created, updated, and deleted in each event.
If consumers already trust the provider to do validation on their end, they could get by with a much more lightweight data stream.
Jetstream is a streaming service that consumes an AT Proto com.atproto.sync.subscribeRepos stream and converts it into lightweight, friendly JSON.
If you want to try it out yourself, you can connect to my public Jetstream instance and view all posts on Bluesky in realtime:
$ websocat "wss://jetstream2.us-east.bsky.network/subscribe?wantedCollections=app.bsky.feed.post"
Note: the above instance is operated by Bluesky PBC and is free to use, more instances are listed in the official repo Readme
Jetstream converts the CBOR-encoded MST blocks produced by the AT Proto firehose and translates them into JSON objects that are easier to interface with using standard tooling available in programming languages.
Since Repo MSTs only contain records in their leaf nodes, this means Jetstream can drop all of the blocks in an event except for those of the leaf nodes, typically leaving only one block per event.
In reality, this means that Jetstream’s JSON firehose is nearly 1/10 the size of the full protocol firehose for the same events, but lacks the verifiability and signatures included in the protocol-level firehose.
Jetstream events end up looking something like:
{
  "did": "did:plc:eygmaihciaxprqvxpfvl6flk",
  "time_us": 1725911162329308,
  "type": "com",
  "commit": {
    "rev": "3l3qo2vutsw2b",
    "type": "c",
    "collection": "app.bsky.feed.like",
    "rkey": "3l3qo2vuowo2b",
    "record": {
      "$type": "app.bsky.feed.like",
      "createdAt": "2024-09-09T19:46:02.102Z",
      "subject": {
        "cid": "bafyreidc6sydkkbchcyg62v77wbhzvb2mvytlmsychqgwf2xojjtirmzj4",
        "uri": "at://did:plc:wa7b35aakoll7hugkrjtf3xf/app.bsky.feed.post/3l3pte3p2e325"
      }
    },
    "cid": "bafyreidwaivazkwu67xztlmuobx35hs2lnfh3kolmgfmucldvhd3sgzcqi"
  }
}
Each event lets you know the DID of the repo it applies to, when it was seen by Jetstream (a time-based cursor), and up to one updated repo record as serialized JSON.
Check out this 10 second CPU profile of Jetstream serving 200k evt/sec to a local consumer:
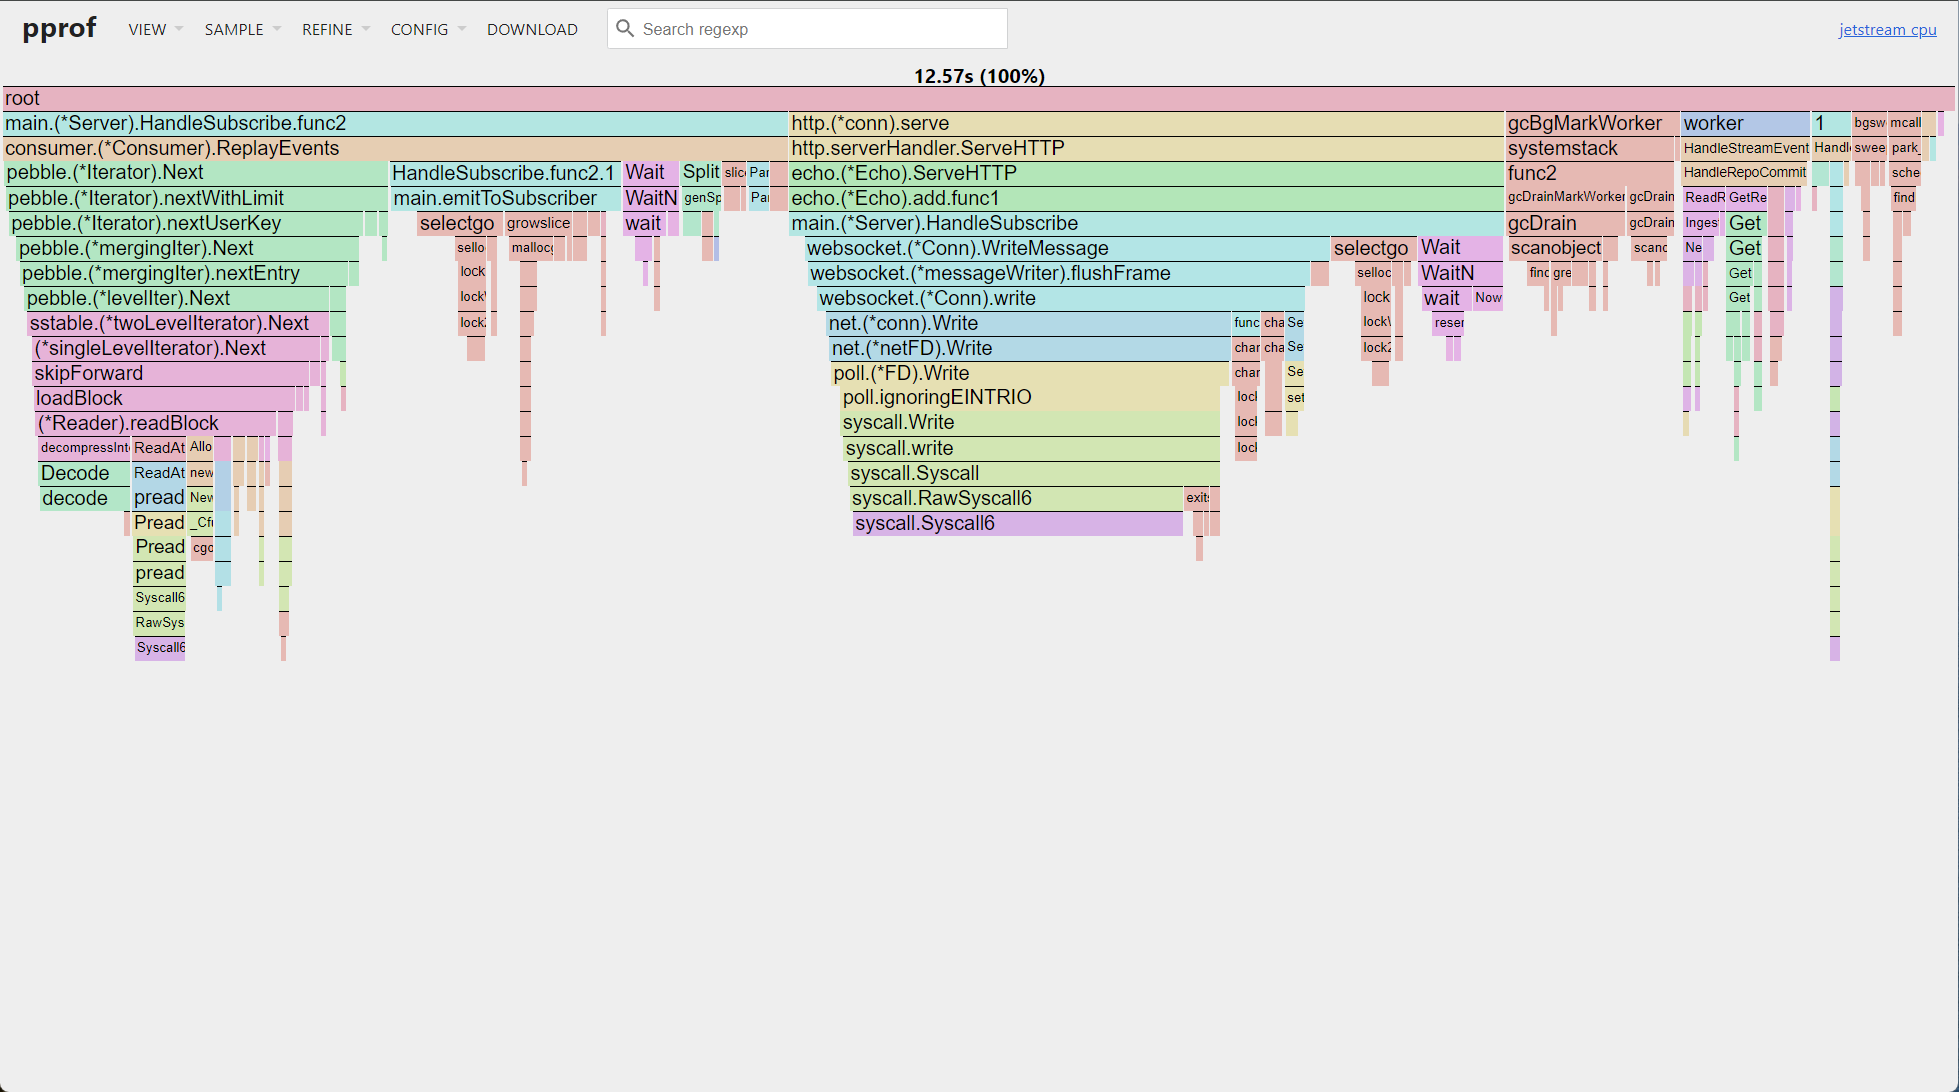
By dropping the MST and verification overhead by consuming from relay we trust, we’ve reduced the size of a firehose of all events on the network from 232 GB/day to ~41GB/day, but we can do better.
zstd
I recently read a great engineering blog from Discord about their use of zstd to compress websocket traffic to/from their Gateway service and client applications.
Since Jetstream emits marshalled JSON through the websocket for developer-friendliness, I figured it might be a neat idea to see if we could get further bandwidth reduction by employing zstd to compress events we send to consumers.
zstd has two basic operating modes, “simple” mode and “streaming” mode.
At first glance, streaming mode seems like it’d be a great fit. We’ve got a websocket connection with a consumer and streaming mode allows the compression to get more efficient over the lifetime of the connection.
I went and implemented a streaming compression version of Jetstream where a consumer can request compression when connecting and will get zstd compressed JSON sent as binary messages over the socket instead of plaintext.
Unfortunately, this had a massive impact on Jetstream’s server-side CPU utilization. We were effectively compressing every message once per consumer as part of their streaming session. This was not a scalable approach to offering compression on Jetstream.
Additionally, Jetstream stores a buffer of the past 24 hours (configurable) of events on disk in PebbleDB to allow consumers to replay events before getting transitioned into live-tailing mode.
Jetstream stores serialized JSON in the DB, so playback is just shuffling the bytes into the websocket without having to round-trip the data into a Go struct.
When we layer in streaming compression, playback becomes significantly more expensive because we have to compress outgoing events on-the-fly for a consumer that’s catching up.
In real numbers, this increased CPU usage of Jetstream by 23% while lowering the throughput of playback from ~200k evt/sec to ~28k evt/sec for a single local consumer.
When in streaming mode, we can’t leverage the bytes we compress for one consumer and reuse them for another consumer because zstd’s streaming context window may not be in sync between the two consumers. They haven’t received exactly the same data in the session so the clients on the other end don’t have their state machines in the same state.
Since streaming mode’s primary advantage is giving us eventually better efficiency as the encoder learns about the data, what if we just taught the encoder about the data at the start and compress each message statelessly?
zstd offers a mechanism for initializing an encoder/decoder with pre-optimized settings by providing a dictionary trained on a sample of the data you’ll be encoding/decoding.
Using this dictionary, zstd essentially uses it’s smallest encoded representations for the most frequently seen patterns in the sample data. In our case, where we’re compressing serialized JSON with a common event shape and lots of common property names, training a dictionary on a large number of real events should allow us to represent the common elements among messages in the smallest number of bytes.
For take two of Jetstream with zstd, let’s to use a single encoder for the whole service that utilizes a custom dictionary trained on 100,000 real events.
We can use this encoder to compress every event as we see it, before persisting and emitting it to consumers. Now we end up with two copies of every event, one that’s just serialized JSON, and one that’s statelessly compressed to zstd using our dictionary.
Any consumers that want compression can have a copy of the dictionary on their end to initialize a decoder, then when we broadcast the shared compressed event, all consumers can read it without any state or context issues.
This requires the consumers and server to have a pre-shared dictionary, which is a major drawback of this implementation but good enough for our purposes.
That leaves the problem of event playback for compression-enabled clients.
An easy solution here is to just store the compressed events as well!
Since we’re only sticking the JSON records into our PebbleDB, the actual size of the 24 hour playback window is <8GB with sstable compression. If we store a copy of the JSON serialized event and a copy of the zstd compressed event, this will, at most, double our storage requirements.
Then during playback, if the consumer requests compression, we can just shuffle bytes out of the compressed version of the DB into their socket instead of having to move it through a zstd encoder.
Running with a custom dictionary, I was able to get the average Jetstream event down from 482 bytes to just 211 bytes (~0.44 compression ratio).
Jetstream allows us to live tail all posts on Bluesky as they’re posted for as little as ~850 MB/day, and we could keep up with all events moving through the firehose during the Brazil Twitter Exodus weekend for 18GB/day (down from 232GB/day).
With this scheme, Jetstream is required to compress each event only once before persisting it to disk and emitting it to connected consumers.
The CPU impact of these changes is significant in proportion to Jetstream’s incredibly light load but it’s a flat cost we pay once no matter how many consumers we have.
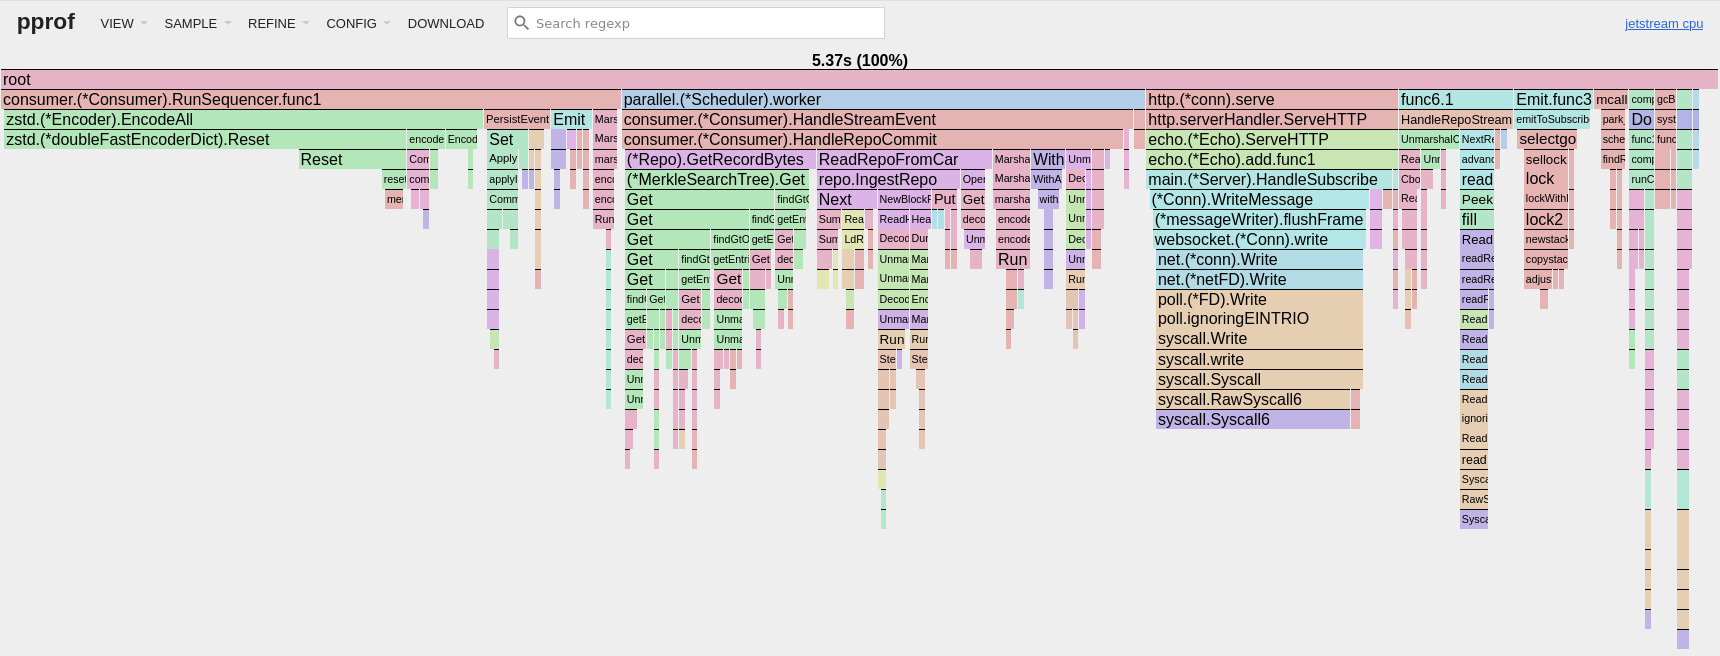
(CPU profile from a 30 second pprof sample with 12 consumers live-tailing Jetstream)
Additionally, with Jetstream’s shared buffer broadcast architecture, we keep memory allocations incredibly low and the cost per consumer on CPU and RAM is trivial. In the allocation profile below, more than 80% of the allocations are used to consume the full protocol firehose.

The total resident memory of Jetstream sits below 16MB, 25% of which is actually consumed by the new zstd dictionary.

To bring it all home, here’s a screenshot from the dashboard of my public Jetstream instance serving 12 consumers all with various filters and compression settings, running on a $5/mo OVH VPS.
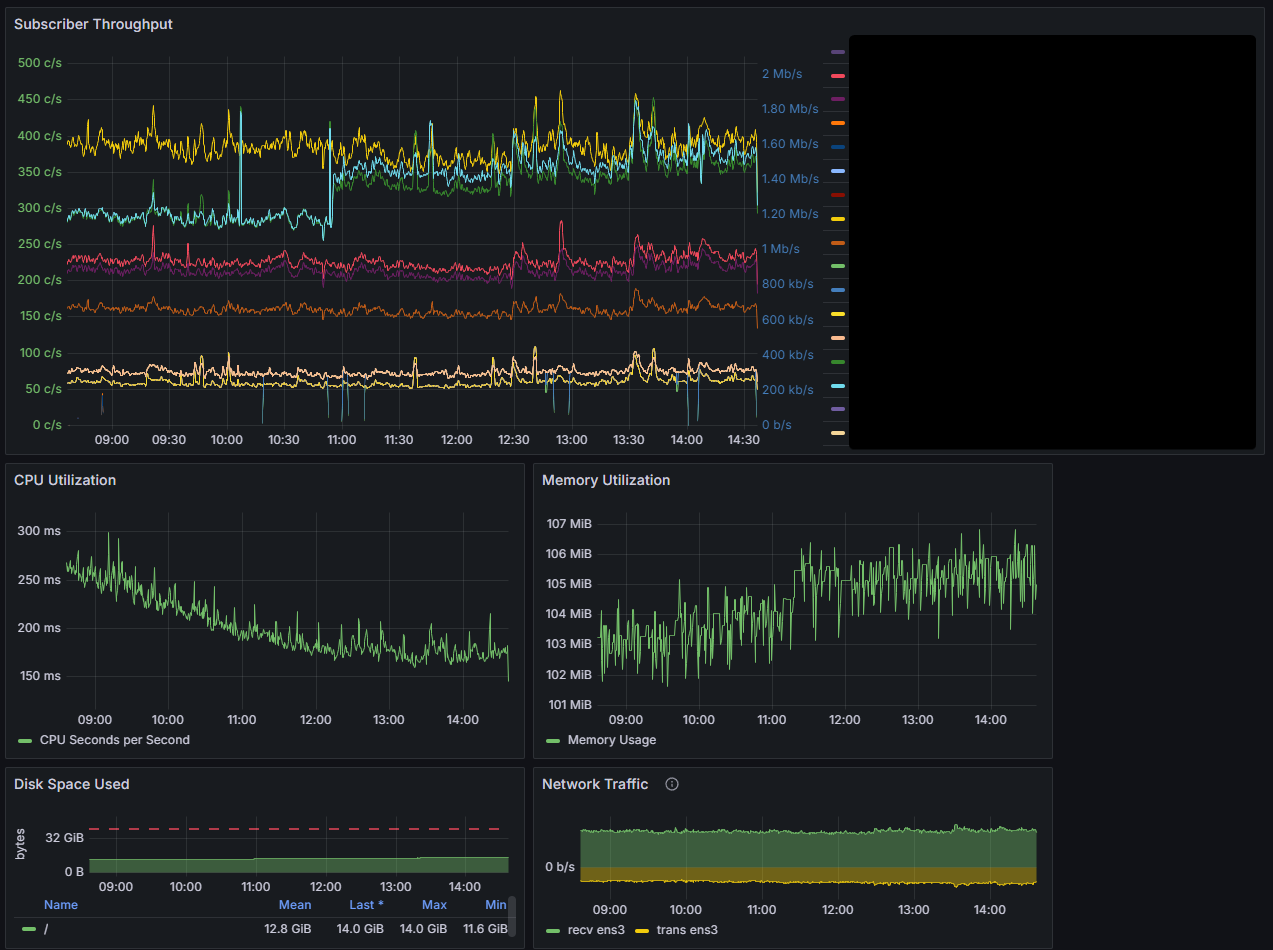
At our new baseline firehose activity, a consumer of the protocol-level firehose would require downloading ~3.16TB/mo to keep up.
A Jetstream consumer getting all created, updated, and deleted records without compression enabled would require downloading ~400GB/mo to keep up.
A Jetstream consumer that only cares about posts and has zstd compression enabled can get by on as little as ~25.5GB/mo, <99% of the full weight firehose.
Feel free to join the conversation about Jetstream and zstd on Bluesky.
2024-07-05 08:00:00
Over the past few weeks, I’ve been building out server-side short video support for Bluesky.
The major aim of this feature is to support short (90 second max) video streaming at a quality that doesn’t cost an arm and a leg for us to provide for free.
In order to stay within these constraints, we’re considering making use of a video CDN that can bear the brunt of the bandwidth required to support Video-on-Demand streaming.
While the CDN is a pretty fully-featured product, we want to avoid too much vendor lock-in and provide some enhancements to our streaming platform that requires extending their offering and getting creative with video streaming protocols.
Some of the things we’d like to be able to do that don’t work out-of-the-box are:
In this post I’ll be focusing on the HLS-related features above, namely view/duration accounting, closed captions, and trailers.
HTTP Live Streaming (HLS) is a standard established by Apple in 2009 that allows for adaptive-bitrate live and Video-on-Demand (VOD) streaming.
For the purposes of this blog post, I’ll restrict my explanations to how HLS VOD streaming works.
A player that implements the HLS protocol is capable of dynamically adjusting the quality of a streamed video based on network conditions. Additionally, a server that implements the HLS protocol should provide one or more variants of a media stream which accommodate varying network qualities to allow for graceful degradation of stream quality without stopping playback.
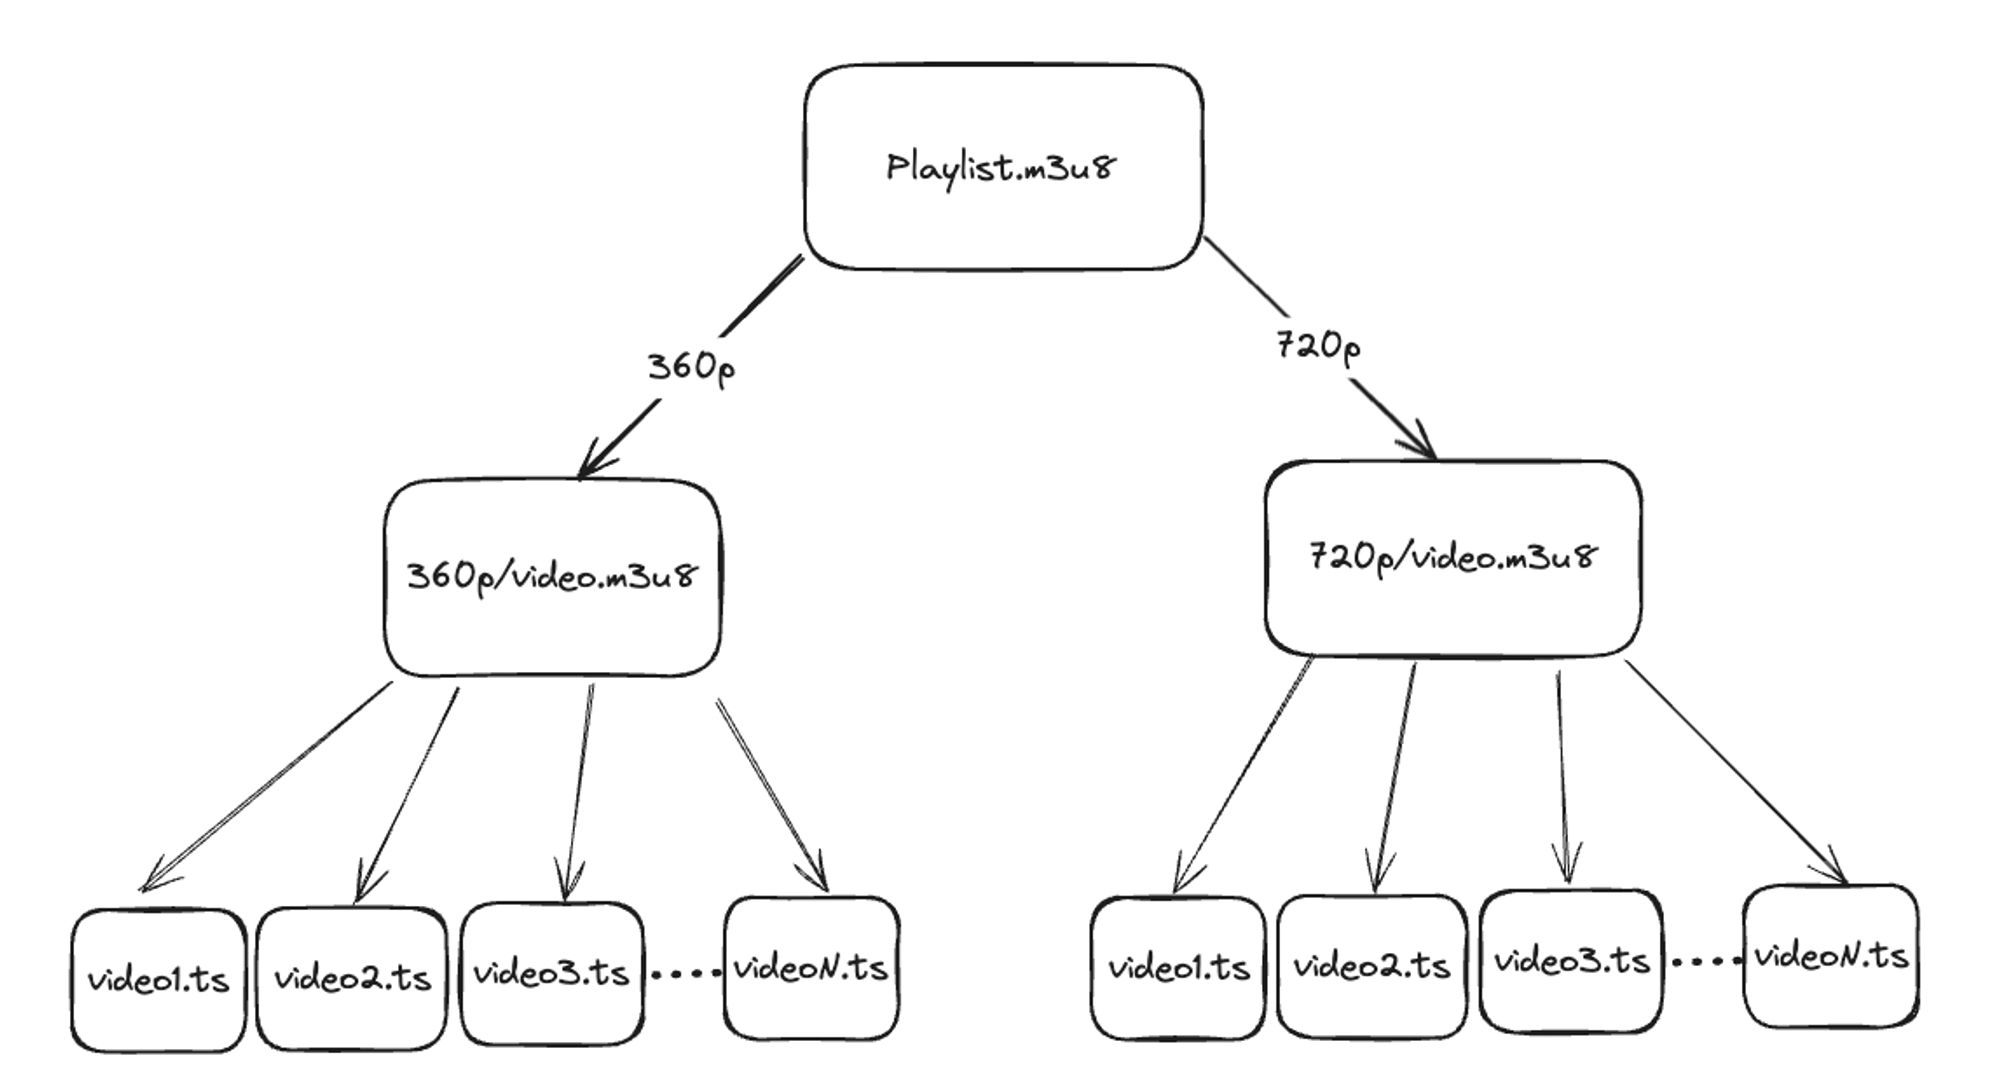
HLS implements this by producing a series of plaintext (.m3u8) “playlist” files that tell the player what bitrates and resolutions the server provides so that the player can decide which variant it should stream.
HLS differentiates between two kinds of “playlist” files: Master Playlists, and Media Playlists.
A Master Playlist is the first file fetched by your video player. It contains a series of variants which point to child Media Playlists. It also describes the approximate bitrate of the variant sources and the codecs and resolutions used by those sources.
$ curl https://my.video.host.com/video_15/playlist.m3u8

#EXTM3U
#EXT-X-VERSION:3
#EXT-X-STREAM-INF:PROGRAM-ID=0,BANDWIDTH=688540,CODECS="avc1.64001e,mp4a.40.2",RESOLUTION=640x360
360p/video.m3u8
#EXT-X-STREAM-INF:PROGRAM-ID=0,BANDWIDTH=1921217,CODECS="avc1.64001f,mp4a.40.2",RESOLUTION=1280x720
720p/video.m3u8
In the above file, the key things to notice are the RESOLUTION parameters and the {res}/video.m3u8 links.
Your media player will generally start with the lowest resolution version before jumping up to higher resolutions once the network speed between you and the server is dialed in.
The links in this file are pointers to Media Playlists, generally as relative paths from the Master Playlist such that, if we wanted to grab the 720p Media Playlist, we’d navigate to: https://my.video.host.com/video_15/720p/video.m3u8.
A Master Playlist can also contain multi-track audio directives and directives for closed-captions but for now let’s move onto the Media Playlist.
A Media Playlist is yet another plaintext file that provides your video player with two key bits of data: a list of media Segments (encoded as .ts video files) and headers for each Segment that tell the player the runtime of the media.
$ curl https://my.video.host.com/video_15/720p/video.m3u8

#EXTM3U
#EXT-X-VERSION:3
#EXT-X-PLAYLIST-TYPE:VOD
#EXT-X-MEDIA-SEQUENCE:0
#EXT-X-TARGETDURATION:4
#EXTINF:4.000,
video0.ts
#EXTINF:4.000,
video1.ts
#EXTINF:4.000,
video2.ts
#EXTINF:4.000,
video3.ts
#EXTINF:4.000,
video4.ts
#EXTINF:2.800,
video5.ts
This Media Playlist describes a video that’s 22.8 seconds long (5 x 4-second Segments + 1 x 2.8-second Segment).
The playlist describes a VOD piece of media, meaning we know this playlist contains the entirety of the media the player needs.
The TARGETDURATION tells us the maximum length of each Segment so the player knows how many Segments to buffer ahead of time. During live streaming, that also lets the player know how frequently to refresh the playlist file to discover new Segments.
Finally the EXTINF headers for each Segment indicate the duration of the following .ts Segment file and the relative paths of the video#.ts tell the player where to load the actual media files from.
At this point, the video player has loaded two .m3u8 playlist files and got lots of metadata about how to play the video but it hasn’t actually loaded any media files.
The .ts files referenced in the Media Playlist are where the real media is, so if we wanted to control the playlists but let the CDN handle serving actual media, we can just redirect those video#.ts requests to our CDN.
.ts files are Transport Stream MPEG-2 encoded short media files that can contain video or audio and video.
To track views of our HLS streams, we can leverage the fact that every video player must first load the Master Playlist.
When a user requests the Master Playlist, we can modify the results dynamically to provide a SessionID to each response and allow us to track the user session without cookies or headers:
#EXTM3U
#EXT-X-VERSION:3
#EXT-X-STREAM-INF:PROGRAM-ID=0,BANDWIDTH=688540,CODECS="avc1.64001e,mp4a.40.2",RESOLUTION=640x360
360p/video.m3u8?session_id=12345
#EXT-X-STREAM-INF:PROGRAM-ID=0,BANDWIDTH=1921217,CODECS="avc1.64001f,mp4a.40.2",RESOLUTION=1280x720
720p/video.m3u8?session_id=12345
Now when their video player fetches the Media Playlists, it’ll include a query-string that we can use to identify the streaming session, ensuring we don’t double-count views on the video and can track which Segments of video were loaded in the session.
#EXTM3U
#EXT-X-VERSION:3
#EXT-X-PLAYLIST-TYPE:VOD
#EXT-X-MEDIA-SEQUENCE:0
#EXT-X-TARGETDURATION:4
#EXTINF:4.000,
video0.ts?session_id=12345&duration=4
#EXTINF:4.000,
video1.ts?session_id=12345&duration=4
#EXTINF:4.000,
video2.ts?session_id=12345&duration=4
#EXTINF:4.000,
video3.ts?session_id=12345&duration=4
#EXTINF:4.000,
video4.ts?session_id=12345&duration=4
#EXTINF:2.800,
video5.ts?session_id=12345&duration=2.8
Finally when the video player fetches the media Segment files, we can measure the Segment view before we redirect to our CDN with a 302, allowing us to know the amount of video-seconds loaded in the session and which Segments were loaded.
This method has limitations, namely that a media player loading a segment doesn’t necessarily mean it showed that segment to the viewer, but it’s the best we can do without an instrumented media player.
Subtitles are included in the Master Playlist as a variant and then are referenced in each of the video variants to let the player know where to load subs from.
#EXTM3U
#EXT-X-VERSION:3
#EXT-X-MEDIA:TYPE=SUBTITLES,GROUP-ID="subs",NAME="en_subtitle",DEFAULT=NO,AUTOSELECT=yes,LANGUAGE="en",FORCED="no",CHARACTERISTICS="public.accessibility.transcribes-spoken-dialog",URI="subtitles/en.m3u8"
#EXT-X-STREAM-INF:PROGRAM-ID=0,BANDWIDTH=688540,CODECS="avc1.64001e,mp4a.40.2",RESOLUTION=640x360,SUBTITLES="subs"
360p/video.m3u8
#EXT-X-STREAM-INF:PROGRAM-ID=0,BANDWIDTH=1921217,CODECS="avc1.64001f,mp4a.40.2",RESOLUTION=1280x720,SUBTITLES="subs"
720p/video.m3u8
Just like with the video Media Playlists, we need a Media Playlist file for the subtitle track as well so that the player knows where to load the source files from and what duration of the stream they cover.
$ curl https://my.video.host.com/video_15/subtitles/en.m3u8

#EXTM3U
#EXT-X-VERSION:3
#EXT-X-MEDIA-SEQUENCE:0
#EXT-X-TARGETDURATION:22.8
#EXTINF:22.800,
en.vtt
In this case, since we’re only serving a short video, we can just provide a single Segment that points at a WebVTT subtitle file encompassing the entire duration of the video.
If you crack open the en.vtt file you’ll see something like:
$ curl https://my.video.host.com/video_15/subtitles/en.vtt

WEBVTT

00:00.000 --> 00:02.000
According to all known laws
of aviation,

00:02.000 --> 00:04.000
there is no way a bee
should be able to fly.

00:04.000 --> 00:06.000
Its wings are too small to get
its fat little body off the ground.

...
The media player is capable of reading WebVTT and presenting the subtitles at the right time to the viewer.
For longer videos you may want to break up your VTT files into more Segments and update the subtitle Media Playlist accordingly.
To provide multiple languages and versions of subtitles, just add more EXT-X-MEDIA:TYPE=SUBTITLES lines to the Master Playlist and tweak the NAME, LANGUAGE (if different), and URI of the additional subtitle variant definitions.
#EXT-X-MEDIA:TYPE=SUBTITLES,GROUP-ID="subs",NAME="en_subtitle",DEFAULT=NO,AUTOSELECT=yes,LANGUAGE="en",FORCED="no",CHARACTERISTICS="public.accessibility.transcribes-spoken-dialog",URI="subtitles/en.m3u8"
#EXT-X-MEDIA:TYPE=SUBTITLES,GROUP-ID="subs",NAME="fr_subtitle",DEFAULT=NO,AUTOSELECT=yes,LANGUAGE="fr",FORCED="no",CHARACTERISTICS="public.accessibility.transcribes-spoken-dialog",URI="subtitles/fr.m3u8"
#EXT-X-MEDIA:TYPE=SUBTITLES,GROUP-ID="subs",NAME="ja_subtitle",DEFAULT=NO,AUTOSELECT=yes,LANGUAGE="ja",FORCED="no",CHARACTERISTICS="public.accessibility.transcribes-spoken-dialog",URI="subtitles/ja.m3u8"
For branding purposes (and in other applications, for advertising purposes), it can be helpful to insert Segments of video into a playlist to change the content of the video without requiring the content be appended to and re-encoded with the source file.
Thankfully, HLS allows us to easily insert Segments into the Media Playlist using this one neat trick:
#EXTM3U
#EXT-X-VERSION:3
#EXT-X-PLAYLIST-TYPE:VOD
#EXT-X-MEDIA-SEQUENCE:0
#EXT-X-TARGETDURATION:4
#EXTINF:4.000,
video0.ts
#EXTINF:4.000,
video1.ts
#EXTINF:4.000,
video2.ts
#EXTINF:4.000,
video3.ts
#EXTINF:4.000,
video4.ts
#EXTINF:2.800,
video5.ts
#EXT-X-DISCONTINUITY
#EXTINF:3.337,
trailer0.ts
#EXTINF:1.201,
trailer1.ts
#EXTINF:1.301,
trailer2.ts
#EXT-X-ENDLIST
In this Media Playlist we use HLS’s EXT-X-DISCONTINUITY header to let the video player know that the following Segments may be in a different bitrate, resolution, and aspect-ratio than the preceding content.
Once we’ve provided the discontinuity header, we can add more Segments just like normal that point at a different media source broken up into .ts files.
Remember, HLS allows us to use relative or absolute paths here, so we could provide a full URL for these trailer#.ts files, or virtually route them so they can retain the path context of the currently viewed video.
Note that we don’t need to provide the discontinuity header here, and we could also name the trailer files something like video{6-8}.ts if we wanted to, but for clarity and proper player behavior, it’s best to use the discontinuity header if your trailer content doesn’t match the bitrate and resolution of the other video Segments.
When the video player goes to play this media, it will continue from video5.ts to trailer0.ts without missing a beat, making it appear as if the trailer is part of the original video.
This approach allows us to dynamically change the contents of the trailer for all videos, heavily cache the trailer .ts Segment files for performance, and avoid having to encode the trailer onto the end of every video source file.
At the end of the day, we’ve now got a video streaming service capable of tracking views and watch session durations, dynamic closed caption support, and branded trailers to help grow the platform.
HLS is not a terribly complex protocol. The vast majority of it is human-readable plaintext files and is easy to inspect in the wild to how it’s used in production.
When I started this project, I knew next to nothing about the protocol but was able to download some .m3u8 files and get digging to discover how the protocol worked, then build my own implementation of a HLS server to accommodate the video streaming needs of Bluesky.
To learn more about HLS, you can check out the official RFC here which describes all the features discussed above and more.
I hope this post encourages you to go explore other protocols you use every day by poking at them in the wild, downloading the files your browser interprets for you, and figuring out how simple some of these apparently “complex” systems are.
If you’re interested in solving problems like these, take a look at our open Job Recs.
If you have any questions about HLS, Bluesky, or other distributed, @scale social media infrastructure, you can find me on Bluesky here and you can discuss this post here.
2024-04-20 08:00:00
In Part 1 of this series, we tried to answer the question “who do you follow who also follows user B” in Bluesky, a social network with millions of users and hundreds of millions of follow relationships.
At the conclusion of the post, we’d developed an in-memory graph store for the network that uses HashMaps and HashSets to keep track of the followers of every user and the set of users they follow, allowing bidirectional lookups, intersections, unions, and other set operations for combining social graph data.
I received some helpful feedback after that post where several people pointed me towards Roaring Bitmaps as a potential improvement on my implementation.
They were right, Roaring Bitmaps would be an excellent fit for my Graph service, GraphD, and could also provide me with a much needed way to quickly persist and load the Graph data to and from disk on startup, hopefully reducing the startup time of the service.
If you just want to dive into the Roaring Bitmap spec, you can read the paper here, but it might be easier to first talk about bitmaps in general.
You can think of a bitmap as a vector of one-bit values (like booleans) that let you encode a set of integer values.
For instance, say we have 10,000 users on our website and want to keep track of which users have validated their email addresses. We could do this by creating a list of the uint32 user IDs of each user, in which case if all 10,000 users have validated their emails we’re storing 10k * 32 bits = 40KB.

Or, we could create a vector of single-bit values that’s 10,000 bits long (10k / 8 = 1.25KB), then if a user has confirmed their email we can set the value at the index of their UID to 1.

If we want to create a list of all the UIDs of validated accounts, we can walk the vector and record the index of each non-zero bit. If we want to check if user n has validated their email, we can do a O(1) lookup in the bitmap by loading the bit at index n and checking if it’s set.
Now when talking about our social network problem, we’re dealing with a few more than 10,000 UIDs. We need to keep track of 5.5M users and whether or not the user follows or is followed by any of the other 5.5M users in the network.
To keep a bitmap of “People who follow User A”, we’re going to need 5.5M bits which would require (5.5M / 8) ~687KB of space.

If we wanted to keep bitmaps of “People who follow User A” and “People who User A follows”, we’d need ~1.37MB of space per user using a simple bitmap, meaning we’d need 5,500,000 * 1.37MB = ~7.5 Terabytes of space!
Clearly this isn’t an improvement of our strategy from Part 1, so how can we make this more efficient?
One strategy for compressing the bitmap is to take consecutive runs of 0’s or 1’s (i.e. 00001110000001) in the bitmap and turn them into a number.
For instance if we had an account that followed only the last 100 accounts in our social network, the first 5,499,900 indices in our bitmap would be 0’s and so we could represent the bitmap by saying: 5,499,900 0's, then 100 1's which you notice I’ve written here in a lot fewer than 687KB and a computer could encode using two uint32 values plus two bits (one indicator bit for the state of each run) for a total of 66 bits.
This strategy is called Run Length Encoding (RLE) and works pretty well but has a few drawbacks: mainly if your data is randomly and heavily populated, you may not have many consecutive runs (imagine a bitset where every odd bit is set and every even bit is unset). Also lookups and evaluation of the bitset requires walking the whole bitset to figure out where the index you care about lives in the compressed format.
Thankfully there’s a more clever way to compress bitmaps using a strategy called Roaring Bitmaps.
A brief description of the storage strategy for Roaring Bitmaps from the official paper is as follows:
We partition the range of 32-bit indexes ([0, n)) into chunks of 2^16 integers sharing the same 16 most significant digits. We use specialized containers to store their 16 least significant bits. When a chunk contains no more than 4096 integers, we use a sorted array of packed 16-bit integers. When there are more than 4096 integers, we use a 2^16-bit bitmap.
Thus, we have two types of containers: an array container for sparse chunks and a bitmap container for dense chunks. The 4096 threshold insures that at the level of the containers, each integer uses no more than 16 bits.
These bitmaps are designed to support both densely and sparsely distributed data and can provide high performance binary set operations (and/or/etc.) operating on the containers within two or more bitsets in parallel.
For more info on how Roaring Bitmaps work and some neat diagrams, check out this excellent primer on Roaring Bitmaps by Vikram Oberoi.
So, how does this help us build a better graph?
Let’s get back to our GraphD Service, this time in Go instead of Rust.
For each user we can keep track of a struct with two bitmaps:
type FollowMap struct {
    followingBM *roaring.Bitmap
    followingLk sync.RWMutex

    followersBM *roaring.Bitmap
    followersLk sync.RWMutex
}
Our FollowMap gives us a Roaring Bitmap for both the set of users we follow, and the set of users who follow us.
Adding a Follow to the graph just requires we set the right bits in both user’s respective maps:
// Note I've removed locking code and error checks for brevity
func (g *Graph) addFollow(actorUID, targetUID uint32) {
    actorMap, _ := g.g.Load(actorUID)
    actorMap.followingBM.Add(targetUID)

    targetMap, _ := g.g.Load(targetUID)
    targetMap.followersBM.Add(actorUID)
}
Even better if we want to compute the intersections of two sets (i.e. the people User A follows who also follow User B) we can do so in parallel:
// Note I've removed locking code and error checks for brevity
func (g *Graph) IntersectFollowingAndFollowers(actorUID, targetUID uint32) ([]uint32, error) {
    actorMap, ok := g.g.Load(actorUID)
    targetMap, ok := g.g.Load(targetUID)

    intersectMap := roaring.ParAnd(4, actorMap.followingBM, targetMap.followersBM)

    return intersectMap.ToArray(), nil
}
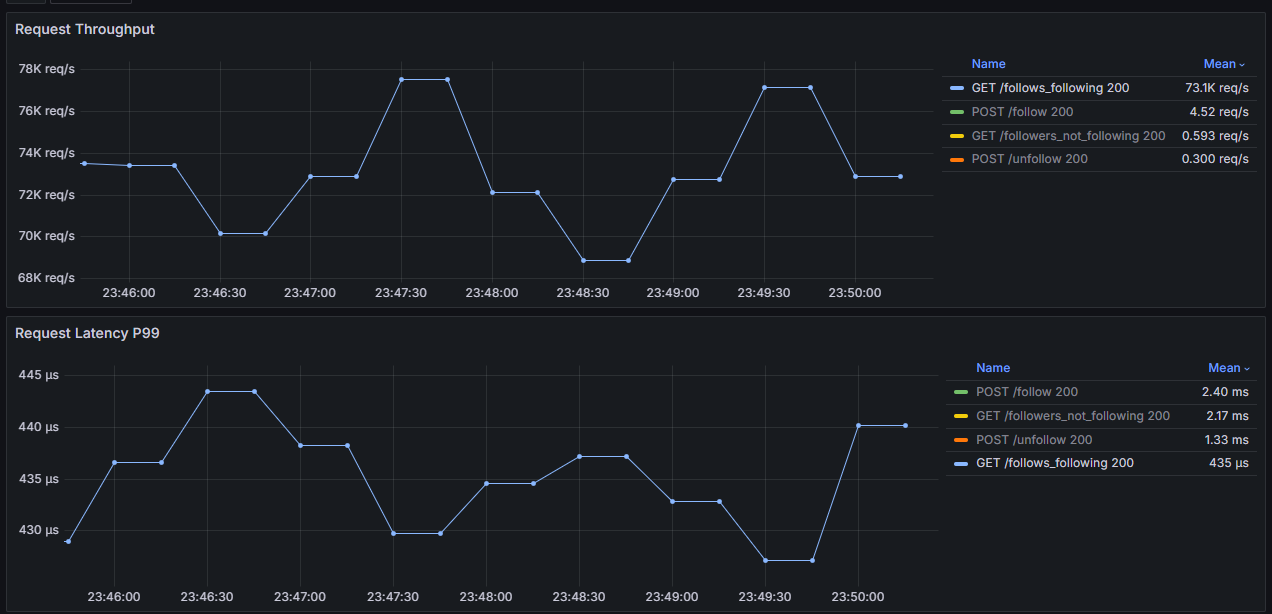
Storing the entire graph as Roaring Bitmaps in-memory costs us around 6.5GB of RAM and allows us to perform set intersections between moderately large sets (with hundreds of thousands of set bits) in under 500 microseconds while serving over 70k req/sec!
And the best part of all? We can use Roaring’s serialization format to write these bitmaps to disk or transfer them over the network.
In the original version of GraphD, on startup the service would read a CSV file with an adjacency list of the (ActorDID, TargetDID) pairs of all follows on the network.
This required creating a CSV dump of the follows table, pausing writes to the follows table, then bringing up the service and waiting 5 minutes for it to read the CSV file, intern the DIDs as uint32 UIDs, and construct the in-memory graph.
This process is slow, pauses writes for 5 minutes, and every time our service restarts we have to do it all over again!
With Roaring Bitmaps, we’re now given an easy way to effectively serialize a version of the in-memory graph that is many times smaller than the adjacency list CSV and many times faster to load.
We can serialize the entire graph into a SQLite DB on the local machine where each row in a table contains:
(uid, DID, followers_bitmap, following_bitmap)
Loading the entire graph from this SQLite DB can be done in around ~20 seconds:
// Note I've removed locking code and error checks for brevity
rows, err := g.db.Query(`SELECT uid, did, following, followers FROM actors;`)
for rows.Next() {
    var uid uint32
    var did string
    var followingBytes []byte
    var followersBytes []byte

    rows.Scan(&uid, &did, &followingBytes, &followersBytes)

    followingBM := roaring.NewBitmap()
    followingBM.FromBuffer(followingBytes)

    followersBM := roaring.NewBitmap()
    followersBM.FromBuffer(followersBytes)

    followMap := &FollowMap{
        followingBM: followingBM,
        followersBM: followersBM,
        followingLk: sync.RWMutex{},
        followersLk: sync.RWMutex{},
    }

    g.g.Store(uid, followMap)
    g.setUID(did, uid)
    g.setDID(uid, did)
}
While the service is running, we can also keep track of the UIDs of actors who have added or removed a follow since the last time we saved the DB, allowing us to periodically flush changes to the on-disk SQLite only for bitmaps that have updated.
Syncing our data every 5 seconds while tailing the production firehose takes 2ms and writes an average of only ~5MB to disk per flush.
The crazy part of this is, the on-disk representation of our entire follow network is only ~1.6GB!
Because we’re making use of Roaring’s compressed serialized format, we can turn the ~6.5GB of in-memory maps into 1.6GB of on-disk data. Our largest bitmap, the followers of the bsky.app account with over 876k members, becomes ~500KB as a blob stored in SQLite.
So, to wrap up our exploration of Roaring Bitmaps for first-degree graph databases, we saw:
My next iteration on this problem will likely be to make use of DGraph’s in-memory Serialized Roaring Bitmap library that allows you to operate on fully-compressed bitmaps so there’s no need to serialize and deserialize them when reading from or writing to disk. It also probably results in significant memory savings as well!
If you’re interested in solving problems like these, take a look at our open Backend Developer Job Rec.
You can find me on Bluesky here, you can chat about this post here.
2024-04-15 08:00:00
I recently shipped a new revision of Bluesky’s global AppView at the start of February and things have been going very well. The system scales and handles millions of users without breaking a sweat, the ScyllaDB-backed Data Plane service sits at under 5% DB load in the most intense production workloads, and things are going great. You know what that means, time to add some new features that absolutely don’t fit the existing scalable data model!
A recent feature I’ve been working on is something we’ve referred to as “Social Proof”, the feature you see on Facebook or Twitter that shows you how many of your friends also follow this user.

In our existing architecture, we handle graph lookups by paging over entire partitions of graph data (i.e. all the follows created by user A) or by looking for the existence of a specific graph relationship (i.e. does A follow B).
That’s working pretty well for things like fanning out posts someone makes to the timelines of their followers or showing that you follow the different authors of posts in a thread.
In the above examples, the “expensive” mode of loading (i.e. paging over all your follows) is done in a paginated manner or as part of an async job during timeline fanout etc.
If we want to show you “people you follow who also follow user B” when you view user B’s profile, we need a fast way to query multiple potentially large sets of data on-demand at interactive speeds.
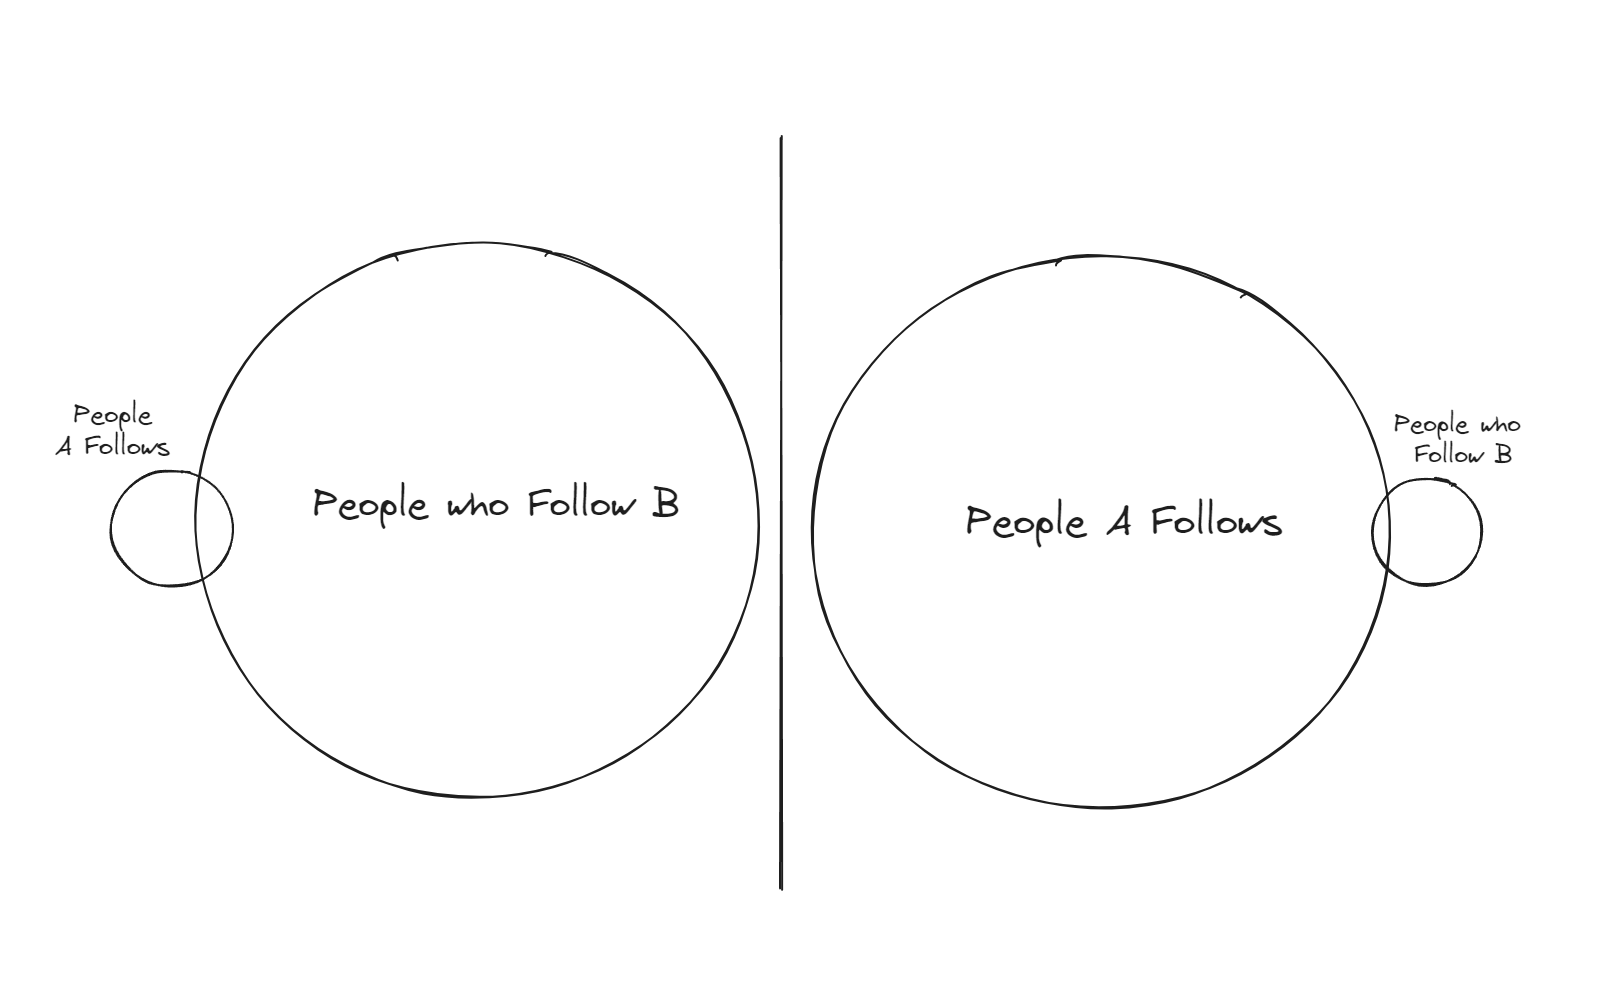
You might recognize this feature as a Set Intersection problem:

When user A views user B’s profile, we want to compute the intersection of the two sets shown in the image above to get the users that A follows who also follow user B so we can show a social proof of user B.
The easiest way to do this is to grab the list of people that User A follows from Scylla, then walk over each of those people and check if they follow user B.
We can reverse this problem and grab the list of people who follow user B and walk the list and check if user A follows them as well, but either way we’re doing a potentially large partition scan to load one of the entire sets, then potentially LOTs of one-row queries to check for the existence of specific follows.
Imagine user A follows 1,000 people and user B has 50,000 followers, that’s one expensive query and then 1,000 tiny queries every time we hydrate User B’s profile for user A and those queries will be different for every user combination we need to load.
A more efficient way to tackle this problem would be to load both sets (A’s follows and followers of B) and then intersect them in-memory in our service.
If we store both sets in-memory as Hash Maps we can iterate over the smaller set and perform fast lookups for membership in the other set. Some programming languages (i.e. rust) even have Set data structures that natively support efficient intersection methods.
But can we even fit this data in memory?
In our network, each user is assigned a DID that looks something like did:plc:q6gjnaw2blty4crticxkmujt which you might notice is a 32 character string. Not all DIDs are this long, they can be longer or shorter but the vast majority (>99.9%) of DIDs on AT Proto are 32 character strings.
The AT Proto network currently has ~160M follow records for ~5.5M users. If we were to store each of these follows in a pair of HashMaps (one to lookup by the actor, one to lookup by the subject) how much memory would we need?
Keys: 32 Bytes * 5.5M Users * 2 Maps = ~352MB

Values: 160M Follows * 32 Bytes * 2 Maps = ~10.24GB
Just the raw keys and values total around 10.5GB with some wiggle room for HashMap provisioning overhead we’re looking at something like 12-14GB of RAM to store the follow graph. With modern computers that’s actually not too crazy and could fit in-memory on a production server no problem, but we can do one step better.
If we convert each DID into a uint64 (a process referred to as “interning”), we can significantly compress the size of our graph and make it faster since our hashing functions will have fewer bytes they need to work with.
UID-Lookup-Maps: (32 Bytes * 5.5M Users) + (8 Bytes * 5.5M Users) = 177MB + 44MB = ~221MB

Keys: 8 Bytes * 5.5M Users * 2 Maps = 88MB

Values: 160M Follows * 8 Bytes * 2 Maps = ~2.56GB
Our new in-memory graph math works out to under 3GB, maybe closer to 4-5 GB including provisioning overhead. This looks even more achievable for our service!
To prove this concept can power production-scale features, I built an implementation in Rust that loads a CSV adjacency list of follows on startup and provides HTTP endpoints for adding new follows, unfollowing, and a few different kinds of queries.
The main structure of the graph is quite simple:
pub struct Graph {
    follows: RwLock<HashMap<u64, HashSet<u64>>>,
    followers: RwLock<HashMap<u64, HashSet<u64>>>,
    uid_to_did: RwLock<HashMap<u64, String>>,
    did_to_uid: RwLock<HashMap<String, u64>>,
    next_uid: RwLock<u64>,
    pending_queue: RwLock<Vec<QueueItem>>,
    pub is_loaded: RwLock<bool>,
}
We keep track of follows in two directions, from the actor side and from the subject side. Additionally we provide two lookup maps, one that turns DIDs to u64s and one that turns u64s back into DIDs.
Finally we keep a variable to know which ID we will assign to the next DID we learn about, and two variables that enqueue follows while we’re loading our graph from the CSV so we don’t drop any events in the meantime.
To perform our Social Proof check, we can make use of this function:
// `get_following` and `get_followers` simply acquire a read lock
// on their respective sets and return a copy of the HashSet
pub fn intersect_following_and_followers(&self, actor: u64, target: u64) -> HashSet<u64> {
    self.get_following(actor)
        .intersection(&self.get_followers(target))
        .cloned()
        .collect()
}
To test the validity of this solution, we can use K6 to execute millions of semi-random requests against the service locally.
For this service, we want to test a worst-case scenario to prove it’ll hold up, so we will intersect the following set of many random users against the 500 largest follower accounts on the network.
Running this test over the course of an hour at a rate of ~41.5k req/sec we see the following results:
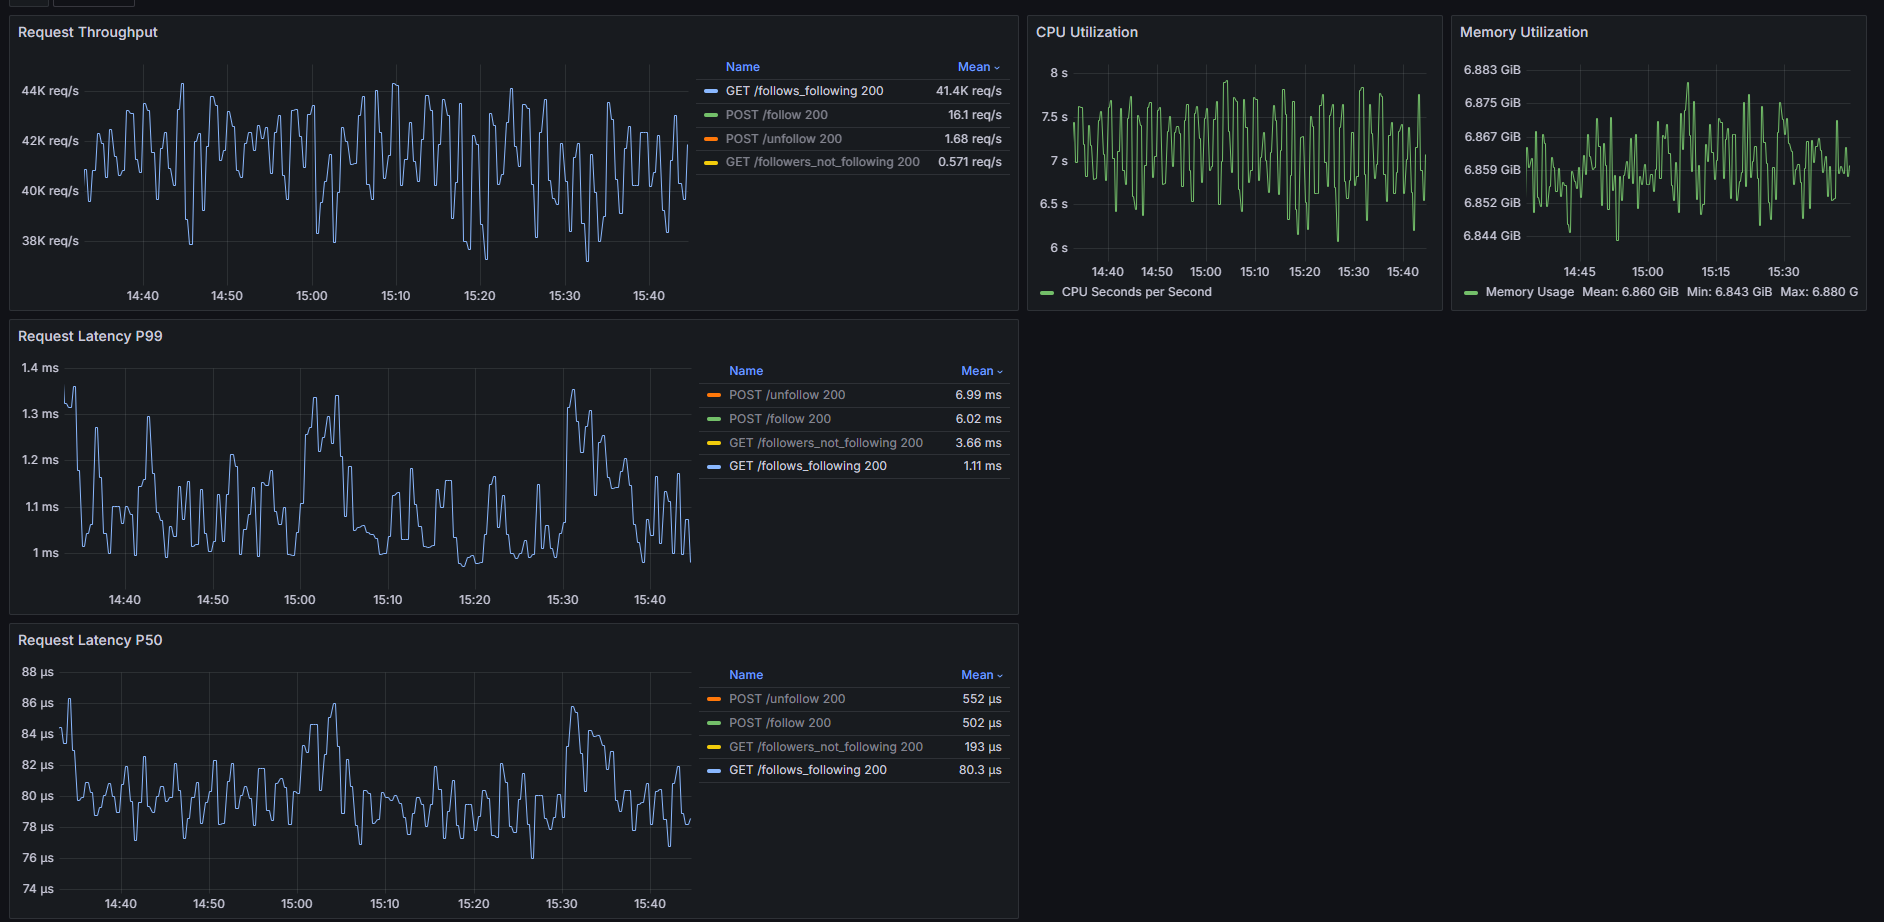
We’re consuming ~6.6GB of resident RAM to support the graph and request load, and our service is responding to these worst-case requests with a p99 latency of ~1.2ms while keeping up with writes from the event firehose and utilizing around 7.5 CPU cores.
Compared to a solution that depends on Redis sets, we’re able to utilize multiple CPU cores to handle requests since we leverage RWLocks that don’t force sequential access for reads.
The best part is, we don’t need to hit our Scylla database at all in order to answer these queries!
We don’t need expensive concurrent fanout or to hammer Scylla partitions to keep fresh follow data in sync to perform set intersections.
We can backfill and then iteratively maintain our follow graph in-memory for the cost of a little bit of startup time (~5 minutes) and a few GB of RAM. Since it’s so cheap, we could even run a couple instances of the service for higher availability and rolling updates.
After this proof of concept, I went back and performed a more realistic sustained load test at 2.65k req/sec for 5 hours to see what memory usage and CPU usage look like over time.
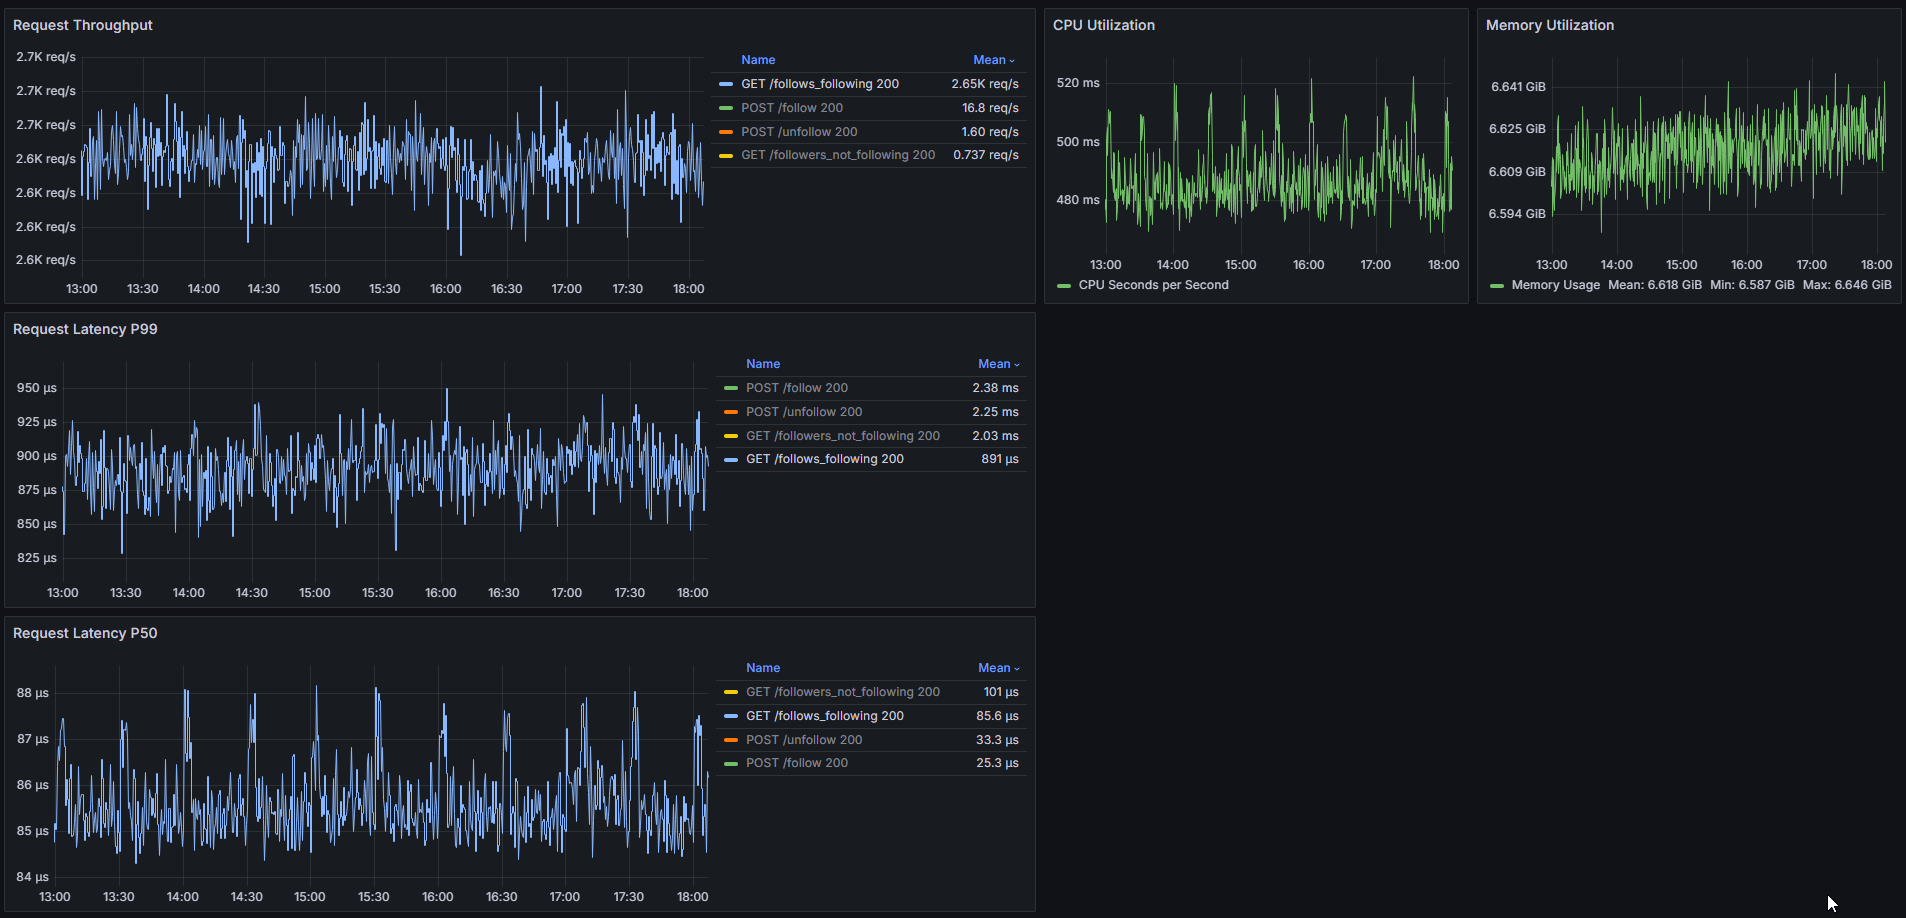
Under a realistic throughput (but worst-case query) production load we keep p99s of under 1ms and consume 0.5 CPU cores while memory utilization trends slowly upward with the growth of the follow graph (+16MiB over 5 hours).
There’s further optimization left to be made by locking individual HashSets instead of the entire follows or following set, but we can leave that for a later day.
If you’re interested in solving problems like these, take a look at our open Backend Developer Job Rec.