2026-07-15 01:20:45
Welcome to the Premium edition of How They Make Money.
Over 300,000 subscribers turn to us for business and investment insights.
In case you missed it:

A new earnings season is here with the big banks kicking us off.
Later this week, we’ll have a look at Netflix and the picks and shovels of the AI era, TSMC and ASML.
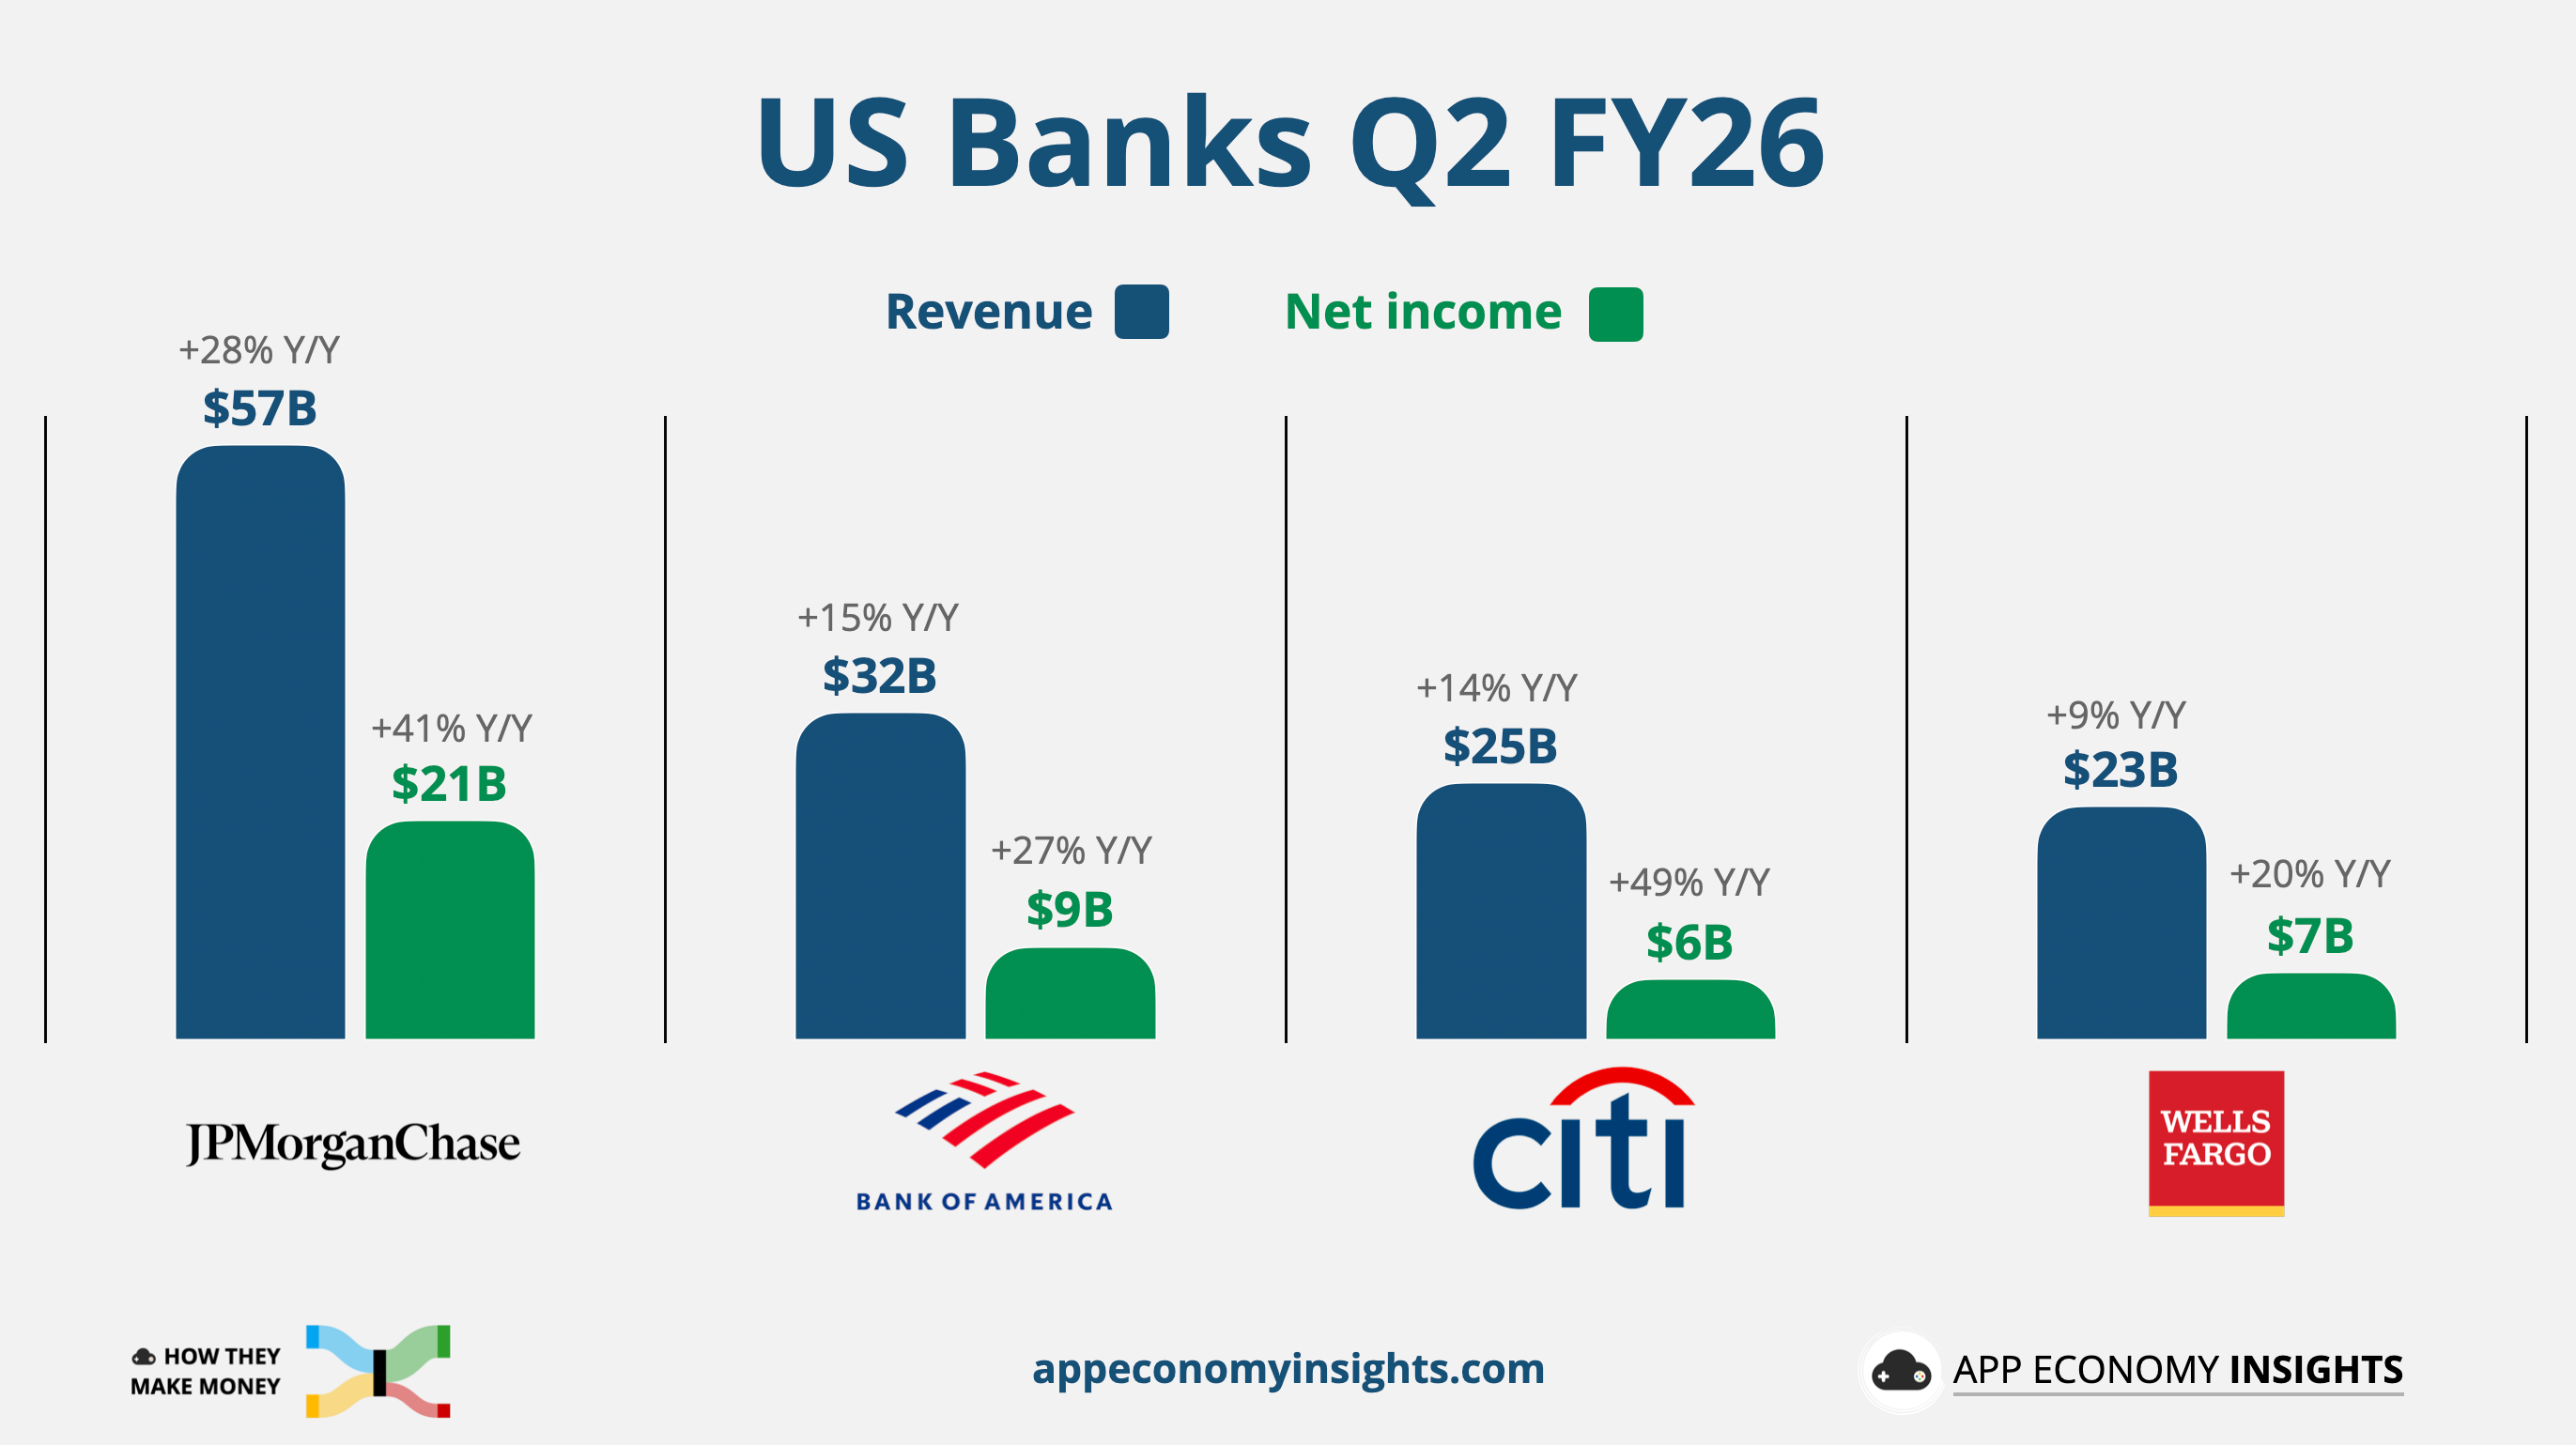
Four of the largest US banks just booked a combined $43 billion in profit, smashing records and beating estimates. They did it despite the Iran war, sticky inflation, and mounting doubts about the staying power of the AI boom.
Even as profits hit new records, the bank chiefs kept pointing to risks shifting beneath the surface: geopolitics, sticky inflation, and elevated asset prices.
High rates and market volatility are a windfall for the banks, while the gap keeps widening between households riding record markets and those squeezed by the cost of living.
Let’s break down the results.
Today at a glance:
JPMorganChase: As Good As It Gets
Bank of America: A Blowout With Caveats
Citigroup: Four Out of Five
Wells Fargo: Fees Do the Heavy Lifting
As a reminder, banks make money through two main revenue streams:
💵 Net Interest Income (NII): The difference between interest earned on loans (like mortgages) and interest paid to depositors (like savings accounts). It’s the primary source of income for many banks and depends on interest rates.
👔 Noninterest Income: The revenue from services unrelated to interest. It includes fees (like ATM charges), advisory services, and trading revenue. Banks relying more on noninterest income are less affected by interest rate changes.
Here are the significant developments shaping Q2 FY26:
💰 Records fall across the board: The four biggest lenders beat expectations despite the Iran war and sticky inflation. The common engine was the trading floor. Every desk cashed in on a volatile quarter, and the results were strong enough that Jamie Dimon told analysts conditions are “getting close to as good as it gets.”
🎰 Trading and dealmaking do the work: Equities desks set records nearly everywhere, led by JPMorgan (+86% Y/Y). A dealmaking revival capped by the SpaceX IPO pushed investment banking to its best showing since 2021. Volatility that could have been a threat became the quarter’s biggest profit source.
🏦 Margin divergence: Beneath the capital-markets boom, the lending picture split. JPMorgan raised its full-year net interest income guide, but net interest margins compressed at Bank of America, Citi, and Wells Fargo as deposit costs stayed stubbornly high. The easy-money era of NII growth is uneven, and the banks leaning hardest on rates are feeling it most.
💵 Capital floods back to shareholders: Confidence showed up in the payouts. JPMorgan authorized a fresh $50 billion buyback and a 10% dividend hike, Wells Fargo repurchased ~$7 billion in the first half and lifted its dividend 11%, and Citi and BofA kept returning capital aggressively. With balance sheets flush, the big banks are signaling they see more room to run.
🛢️ Energy relief, already reversing: June CPI cooled to +3.5% Y/Y, driven almost entirely by a 9.7% drop in gasoline after the Iran ceasefire reopened the Strait of Hormuz. That relief is unwinding fast. The ceasefire collapsed on July 8, oil is climbing again, and the July inflation print will look very different.
📉 The K-shaped consumer holds: Card spending rose 9% Y/Y at both BofA and Wells Fargo, and provisions came in below expectations across the group, signs the consumer is still spending and paying on time. But management remained cautious about affordability for lower-income households, and the divide between asset-rich households and everyone else remains.
🌋 Risks below the surface: Even while celebrating records, Dimon warned of “risks shifting below the surface like tectonic plates,” naming geopolitical conflict, sticky inflation, large fiscal deficits, and elevated asset prices. Charlie Scharf echoed him, cautioning that favorable conditions “do not go on forever.”
🔑 Takeaway: The big banks are posting record profits amid a trading and dealmaking boom, returning capital freely, and leaning on a consumer that’s still holding. But margins are thinning where the boom isn’t reaching, and management keeps pointing to the same tensions that leave little room for error.
Let’s visualize them one by one and highlight the key points.
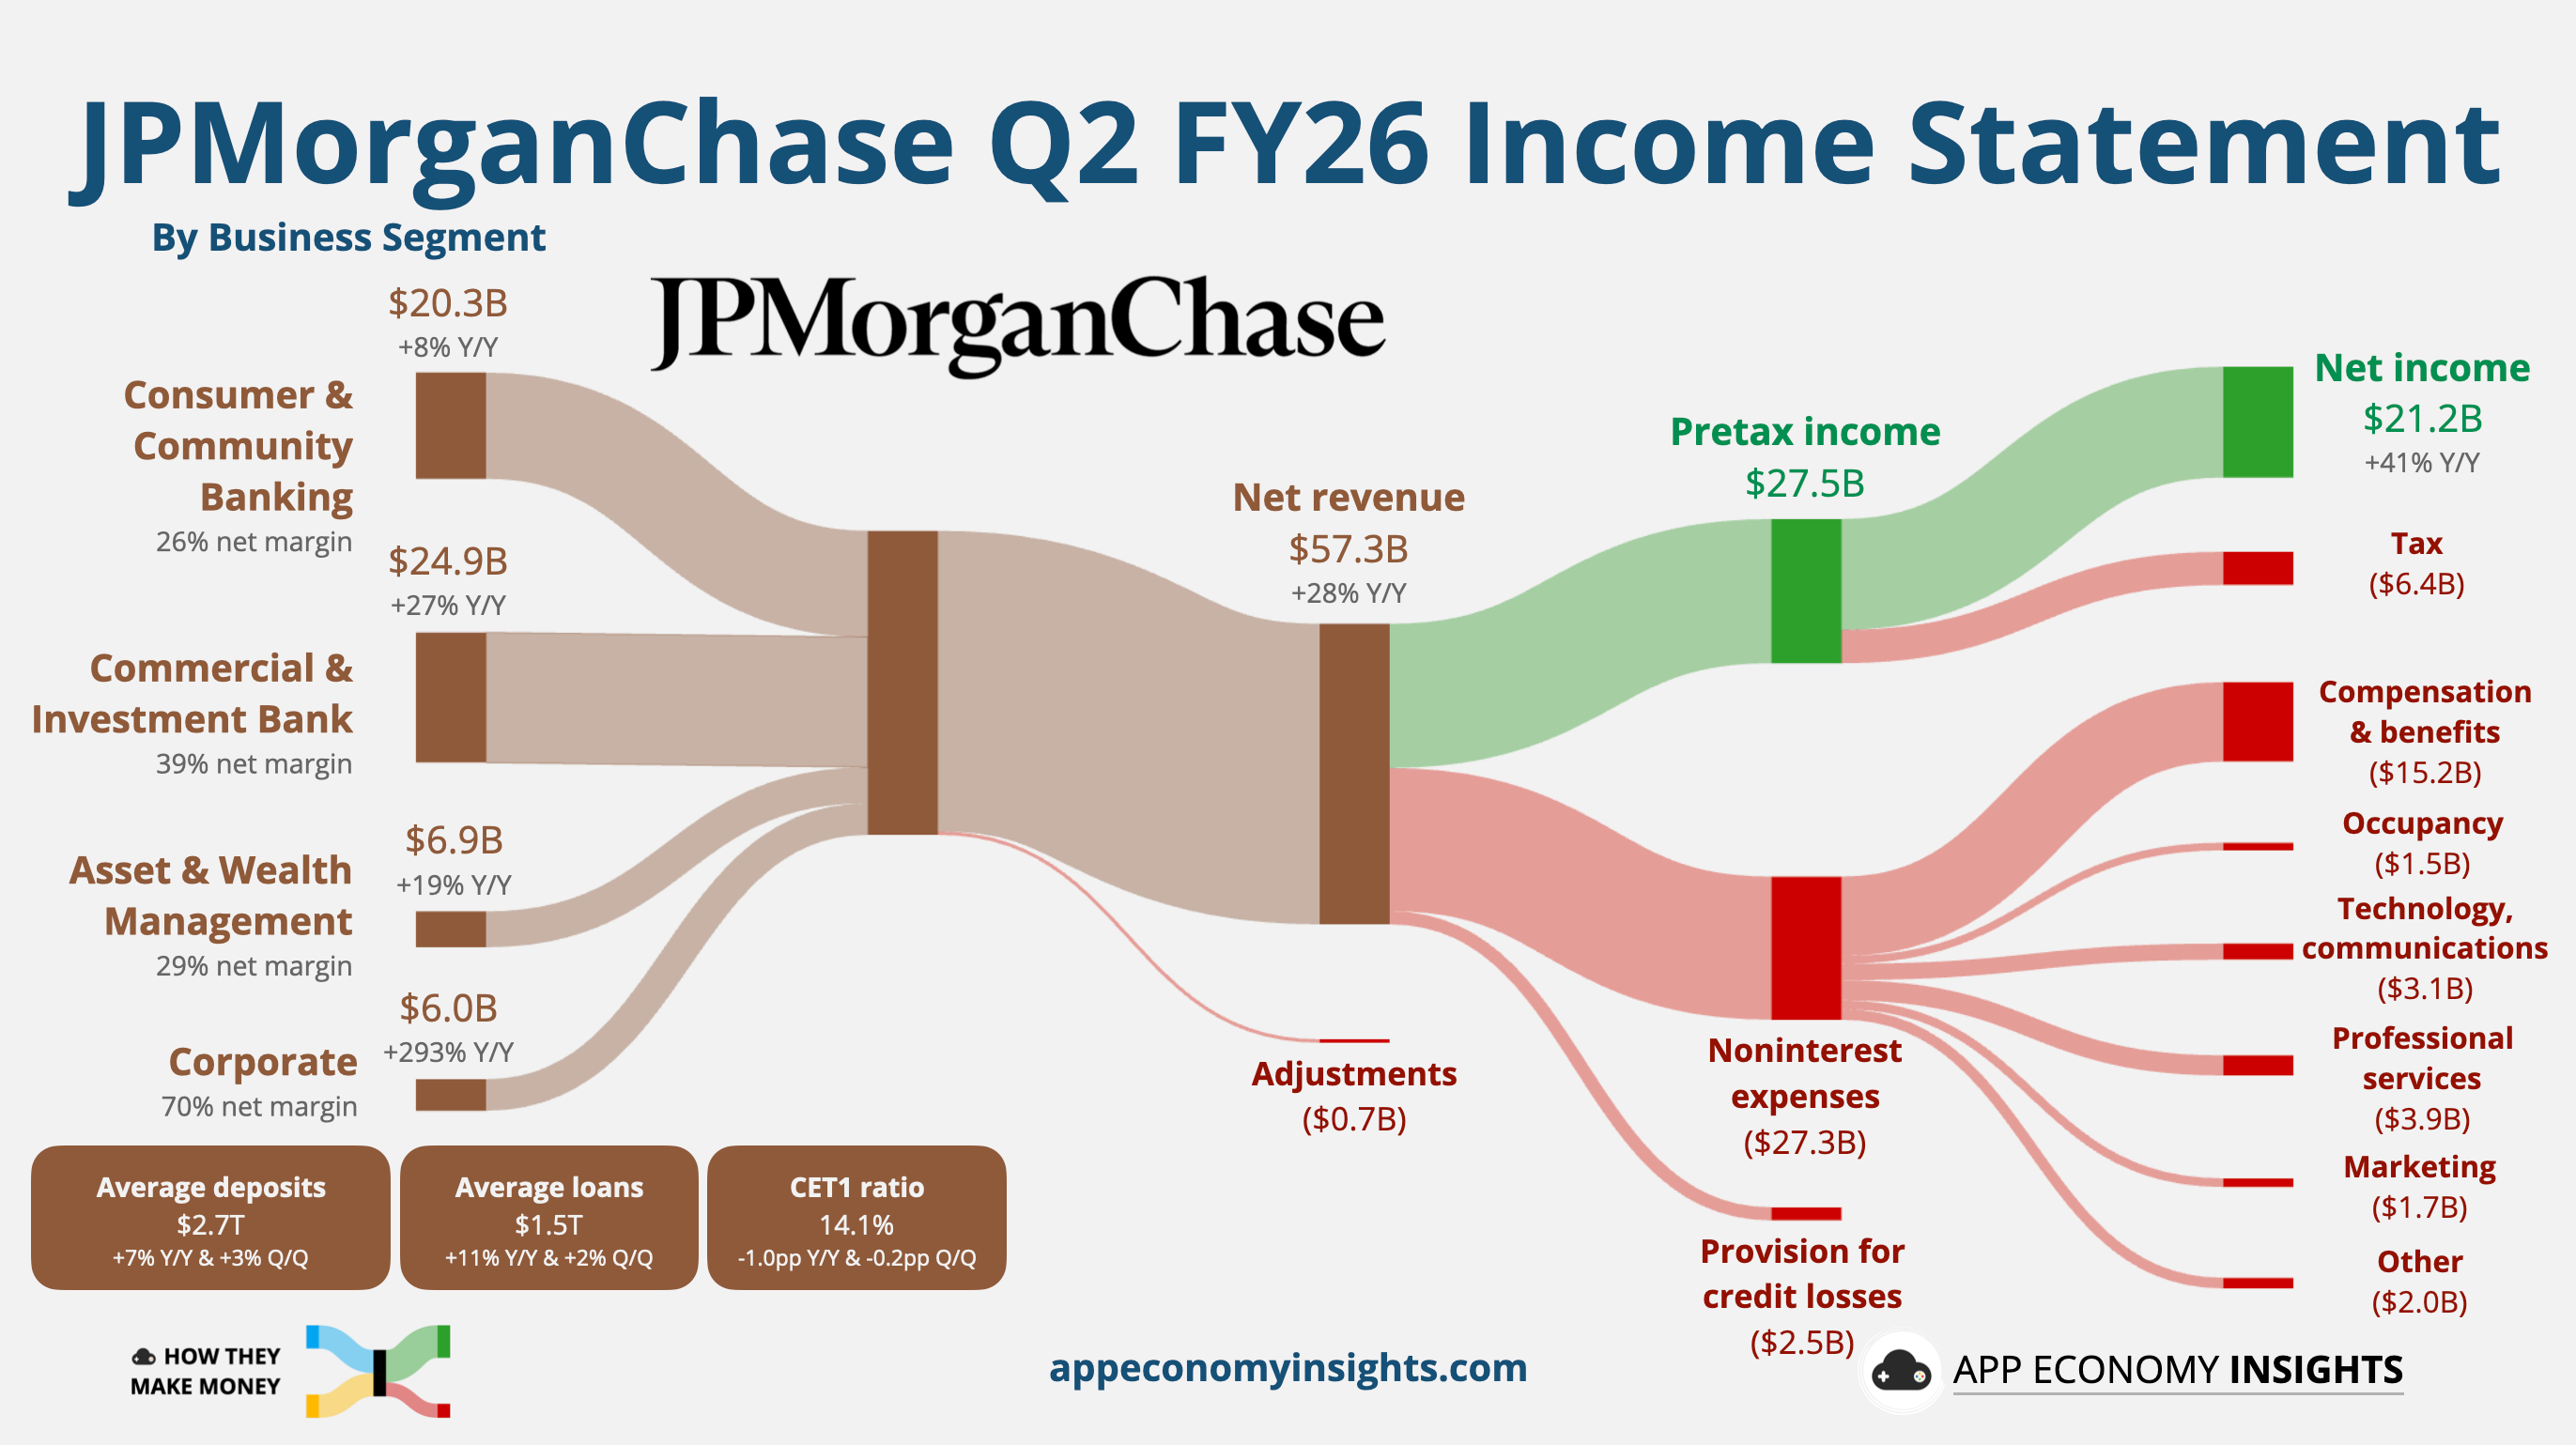
Net revenue grew 28% Y/Y to $57.3 billion ($6.7 billion beat):
Net interest income (NII): $25.5 billion (+10% Y/Y).
Noninterest income: $31.8 billion (+47% Y/Y), lifted by a $4.6 billion one-time Visa gain.
Net income: $21.2 billion (+41% Y/Y).
Adjusted EPS: $6.14 ($0.34 beat).

Key developments:
📈 Equities smash the record: JPMorgan’s stock traders pulled in $6.0 billion (+86% Y/Y), beating even the highest analyst estimate and pushing total trading revenue to a fresh record of $12.1 billion (+35% Y/Y). The volatility that started with the Iran war and rippled through global equity markets, including a chaotic stretch in Korean stocks, handed the desks their best quarter ever.
💳 The Visa windfall: A long-held Visa stake paid off to the tune of $4.6 billion, plus another $1.0 billion in equity investment gains. Reported EPS of $7.70 crushed consensus, but ~$1.56 of that was one-time. Even excluding the windfall, the bank still delivered a 23% return on tangible equity.
🚀 Dealmaking roars back: Investment banking fees jumped 30% Y/Y to $3.3 billion, riding the record SpaceX IPO, heavy index rebalancing, and a wave of AI-related financing. M&A advisory rose 20%, though that fell short of the 27% expected by analysts. CFO Jeremy Barnum called the environment “dynamic and interesting across a whole variety of dimensions.”
🏦 NII guidance raised: Management lifted the NII outlook to ~$105.5 billion (from $103 billion), as higher-for-longer rates extend the tailwind. The card net charge-off forecast also improved, to ~3.2% from 3.4%, a sign that consumer credit is holding better than feared.
💸 Expenses are the catch: Full-year expense guidance climbed to ~$107.5 billion (from $105 billion). Management framed the increase as the cost of doing more business, tied to the elevated activity levels that drove the revenue outperformance.
💰 Capital floods back to shareholders: JPMorgan raised its quarterly dividend 10% to $1.65 and authorized a fresh $50 billion buyback, with CET1 at a comfortable 14.1%. With Dimon having pegged excess capital near $40 billion, the firm has ample room to keep returning cash even as Basel III capital rules loom.
🔑 Takeaways: Every business line set records, and the NII guide flipped from headwind to tailwind versus Q1. Underneath a one-time Visa boost, JPM showed it can monetize volatility, dealmaking, and higher rates all at once.
Key quote:
CEO Jamie Dimon: “These results were the product of a particularly favorable environment with an elevated level of market activity, as well as rigorous execution, years of consistent investment, and thoughtful capital deployment.”
2026-07-11 22:00:58
Welcome to the Saturday PRO edition of How They Make Money.
Over 300,000 subscribers turn to us for business and investment insights.
In case you missed it:
📊 Monthly reports: 200+ companies visualized.
📩 Tuesday articles: Exclusive deep dives and insights.
📚 Access to our archive: Hundreds of business breakdowns.
📩 Saturday PRO reports: Timely insights on the latest earnings.
Today at a glance:
🥤 PepsiCo: Gas Prices Bite
🛩️ Delta: Premium Absorbs Fuel Shock
🍪 General Mills: Reinvestment Phase Ends
PepsiCo’s Q2 revenue rose 6% Y/Y to $24.2 billion ($230 million beat), with non-GAAP EPS of $2.20 ($0.01 miss). Organic revenue growth of 2.4% included effective net pricing plus modest volume gains, with FX adding 2.2 points and M&A 1.8 points. Shares fell by more than 3% anyway.
The North American segment disappointed after Q1’s tentative snack rebound:
Frito-Lay volume went flat, and revenue declined 2%, reversing the momentum from Q1’s 2% volume gain.
North American Beverages volume slid 4%, with operating margin down 90 bps.
International remained the engine, projected to top $40 billion in revenue this year, with Asia Pacific Foods delivering double-digit volume growth.
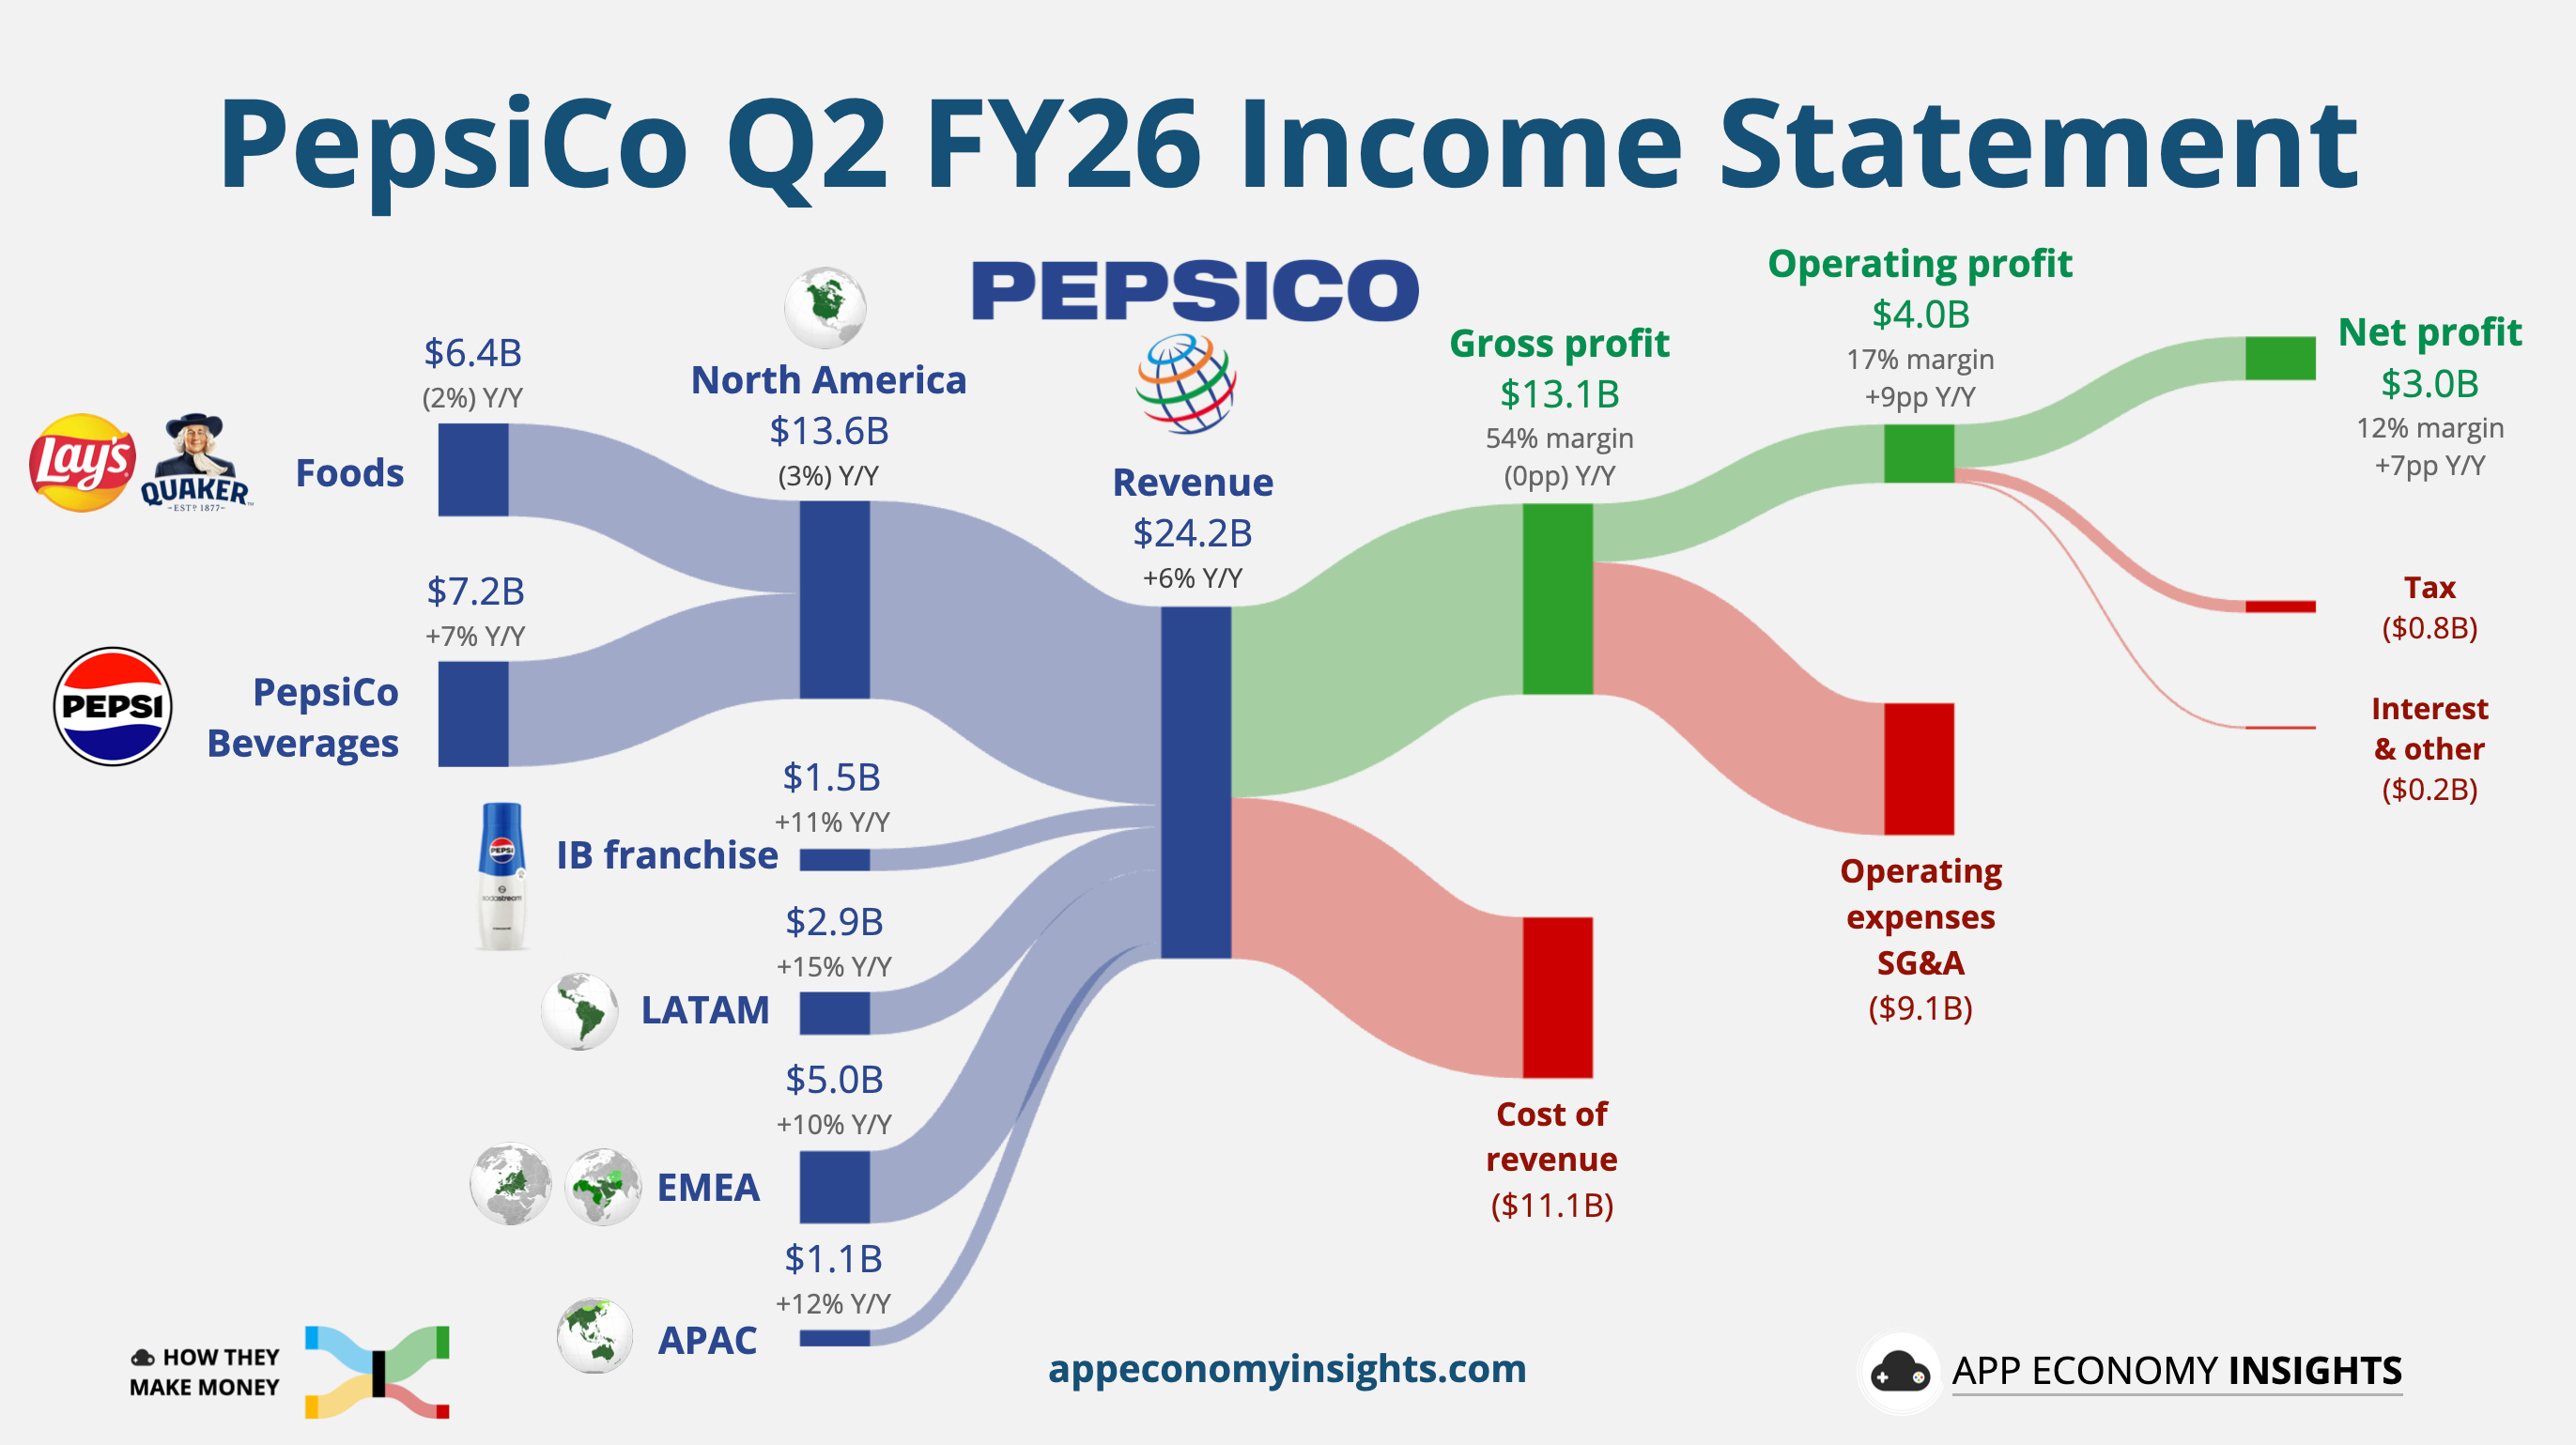
CEO Ramon Laguarta said, “The consumer is worse than what we had anticipated, and it’s driven mainly by gas prices.” US gas prices surged above $4/gallon during Q2 due to the Iran conflict, and Laguarta said the pullback was concentrated in convenience stores and other impulse-purchase channels. PepsiCo is now tweaking its 15% price cuts by segment and has noted delays in regaining the shelf space retailers had promised.
The healthier “permissible portfolio” (protein-fortified snacks, portion-controlled multipacks) hit $3 billion in value and is growing double digits, which Laguarta flagged as a bright spot. Activist Elliott’s pressure to accelerate the turnaround continues in the background.
PepsiCo reaffirmed full-year FY26 guidance, with organic revenue growth of 2–4% and core constant-currency EPS growth of 4–6%, though management flagged that results are likely to land at the low end of the EPS range. Tariff refunds will contribute roughly a full point of EPS growth to offset commodity inflation. The next question is whether the impulse channel recovers as gas prices ease, or whether Frito-Lay needs another pricing reset.
2026-07-10 20:02:57
Welcome to the Free edition of How They Make Money.
Over 300,000 subscribers turn to us for business and investment insights.
In case you missed it:
Starting January 2028, no new PlayStation game will ship on a disc, third-party publishers included. That timeline caught some fans off guard, but the disc gave up its usefulness years ago. Critical day-one patches are now standard, so the plastic in the box is already just a glorified install key with better packaging. Digital accounts for ~80% of Sony's full-game sales, and many smaller titles skip the box altogether.
Take-Two Interactive got a head start on Sony. Its upcoming game, GTA VI, will ship this November with a download code in a box and no disc at all. It’s an admission that a disc has become more of a liability than an asset. A physical disc means locking the code weeks before launch and hoping it doesn’t leak in the meantime.
Killing the disc kills the resale market that’s quietly taxed every publisher for decades. A used copy undercuts the full-price version by a few dollars within days of launch, and the publisher sees nothing from the resale. Publishers tolerated that leak while the market was growing. But Console was gaming's slowest-growing segment in 2025, up just 3% Y/Y to $45 billion, or 22% of the ~$200 billion global games market now dominated by mobile.
AAA budgets keep climbing, and studio layoffs have become routine at big publishers. Microsoft just proved how bad that math has gotten. Xbox is cutting 3,200 jobs, 20% of its workforce, and divesting four studios. CEO Asha Sharma told staff the business is "not healthy," operating at margins three to ten times below those of comparable platform and publishing peers. A business model that stops leaking resale value to GameStop is exactly the fix a stagnant industry needs.
Today at a glance:
💰 Pricing the pure plays
🏴☠️ Can Ubisoft turn it around?
While consoles have trailed mobile gaming for years, GTA VI is shaping up to be the biggest single entertainment release in history, game or otherwise. Some analysts see it selling over 40 million units at launch, with the lowest-priced edition running at $80.
The market is already pricing that in. Take-Two now trades at 8.0x its average net bookings over the past three years, the highest multiple in this peer group.
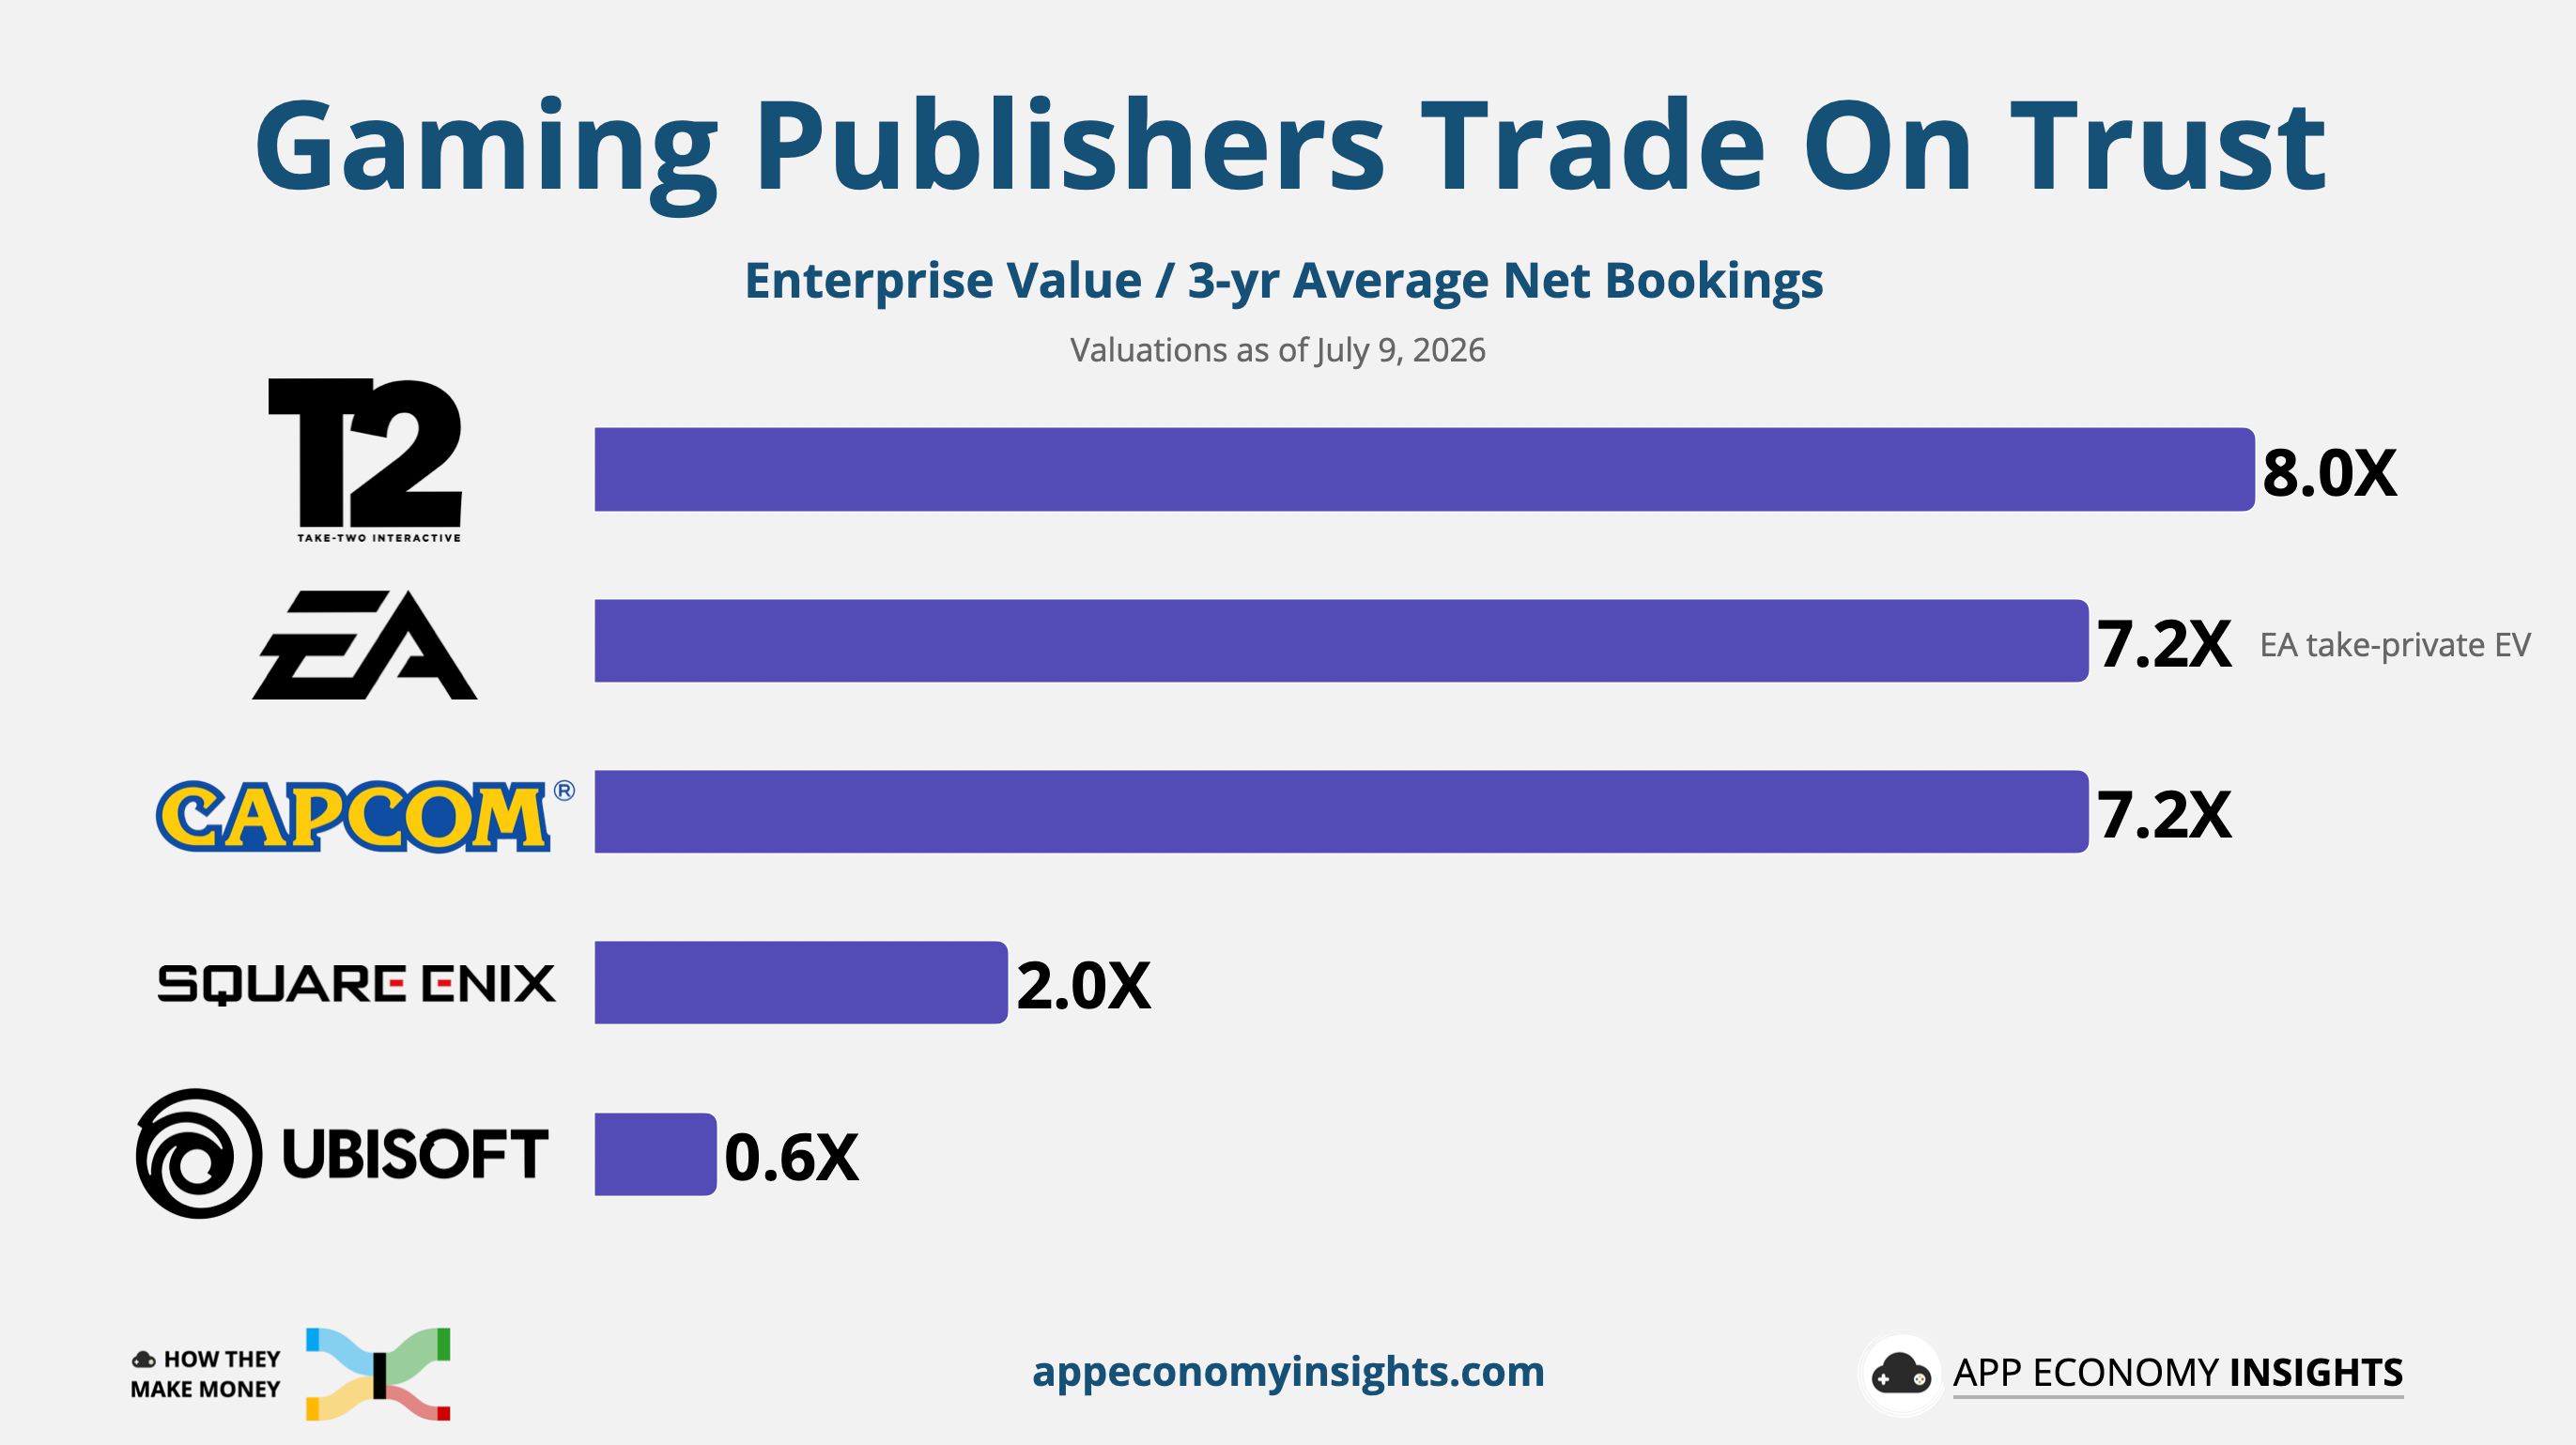
Here's how the net bookings multiples of the leading console publishers stack up:
🇺🇸 Take-Two (8.0x): With an enterprise value near $47 billion, Take-Two is the largest publicly traded standalone gaming publisher. FY27 guidance has net bookings jumping to ~$8.1 billion from $6.7 billion in FY26, which would pull the forward multiple closer to 6x. The market is already pricing a big GTA VI launch.
🇺🇸 EA (7.2x): The Saudi PIF-led consortium took the company private at a $55 billion enterprise value. Live-service sports franchises give EA the most predictable revenue base in the group, which is exactly what a private buyer pays up for.
🇯🇵 Capcom (7.2x): The Japanese publisher is valued at nearly $7 billion and trades at a premium multiple, supported by a standout margin profile (~39% operating margin in FY26). A successful remake strategy turned Resident Evil from nostalgia into a repeatable growth engine, while Monster Hunter and Street Fighter continue to prove that Capcom can refresh mature franchises with strong commercial results. Capcom’s efficiency and consistent execution are what earn a multiple this rich.
🇯🇵 Square Enix (2.0x): Square Enix trades at the low end of the group, with a ~$4 billion valuation. Its RPG franchises, Final Fantasy and Dragon Quest, carry the portfolio. Operating margin sits around 13%, roughly half the peer average, dragged down by uneven execution, bloated budgets, and several high-profile misses. An activist investor is now pushing management to close that gap.
🇫🇷 Ubisoft (0.6x): The French publisher has fallen from a €12 billion enterprise value in 2018 to just over €1 billion today, a collapse driven by escalating budgets on major titles, repeated project cancellations, and franchise fatigue across Assassin's Creed and Far Cry.
Bottom Line: Every publisher in this cohort benefits from Sony killing the disc. But the multiple investors are willing to pay comes down to trust. Great IP only matters if it ships on time and turns into cash.

Assassin’s Creed Black Flag Resynced, a full remake of the studio’s 2013 pirate adventure, just launched on July 9. The original game has been played by over 34 million unique players. Ubisoft wants to follow in Capcom’s footsteps by modernizing its biggest hits. Commercial success of remakes is more predictable, and upfront production costs are usually lower, making it a potent combo. Ubisoft’s CEO, Yves Guillemot, officially confirmed that the company is developing multiple remakes of older Assassin’s Creed games.
The remake is arriving while the company is priced as if bankruptcy is on the horizon. Ubisoft has an enterprise value of ~€1.2 billion, with average annual net bookings of nearly ~€2 billion. Even multiplying this valuation by 3 would put it merely in line with struggling publisher Square Enix.
That price implies a company in slow-motion liquidation rather than an underperforming publisher. As of July 2026, nearly 14% of Ubisoft stock on Euronext Paris is short (people betting the stock will go down).
So what’s happening here? Let’s look at the underlying business.
Ubisoft spent January reorganizing into five Creative Houses, decentralizing decisions that used to run through the center. Vantage Studios ended up holding the crown jewels: Assassin’s Creed, Far Cry, and Rainbow Six. The other four Houses split the rest of the portfolio across multiplayer shooters (Ghost Recon, The Division), live services (The Crew), and casual and family titles (Rayman).
Tencent closed a €1.2 billion investment in Vantage Studios in November 2025, taking a 26% economic interest while Ubisoft retains exclusive control and keeps consolidating the studio’s results. The deal valued Vantage Studios at a pre-money enterprise value of €3.8 billion. That structure suggests that both sides see more value in Vantage than the market is currently assigning to Ubisoft as a whole (€1.2 billion). But the Guillemot family's control and Tencent's right of first refusal make an EA-style buyout unlikely.
Tencent’s cash injection did real work on the balance sheet. Ubisoft closed FY26 (ending in March) with an adjusted net debt of €0.2 billion and cash reserves of €1.3 billion, a very different position from the one that had investors bracing for a covenant breach a year ago.
The relief could be temporary, though. Bondholders can demand ~€0.5 billion back in November. Another ~€0.7 billion follows in late 2027. That is nearly the entire cash pile due before the FY28/FY29 slate can fully repair free cash flow. Add a year of guided burn, and the math stops working. Ubisoft's near-term future hinges on refinancing.
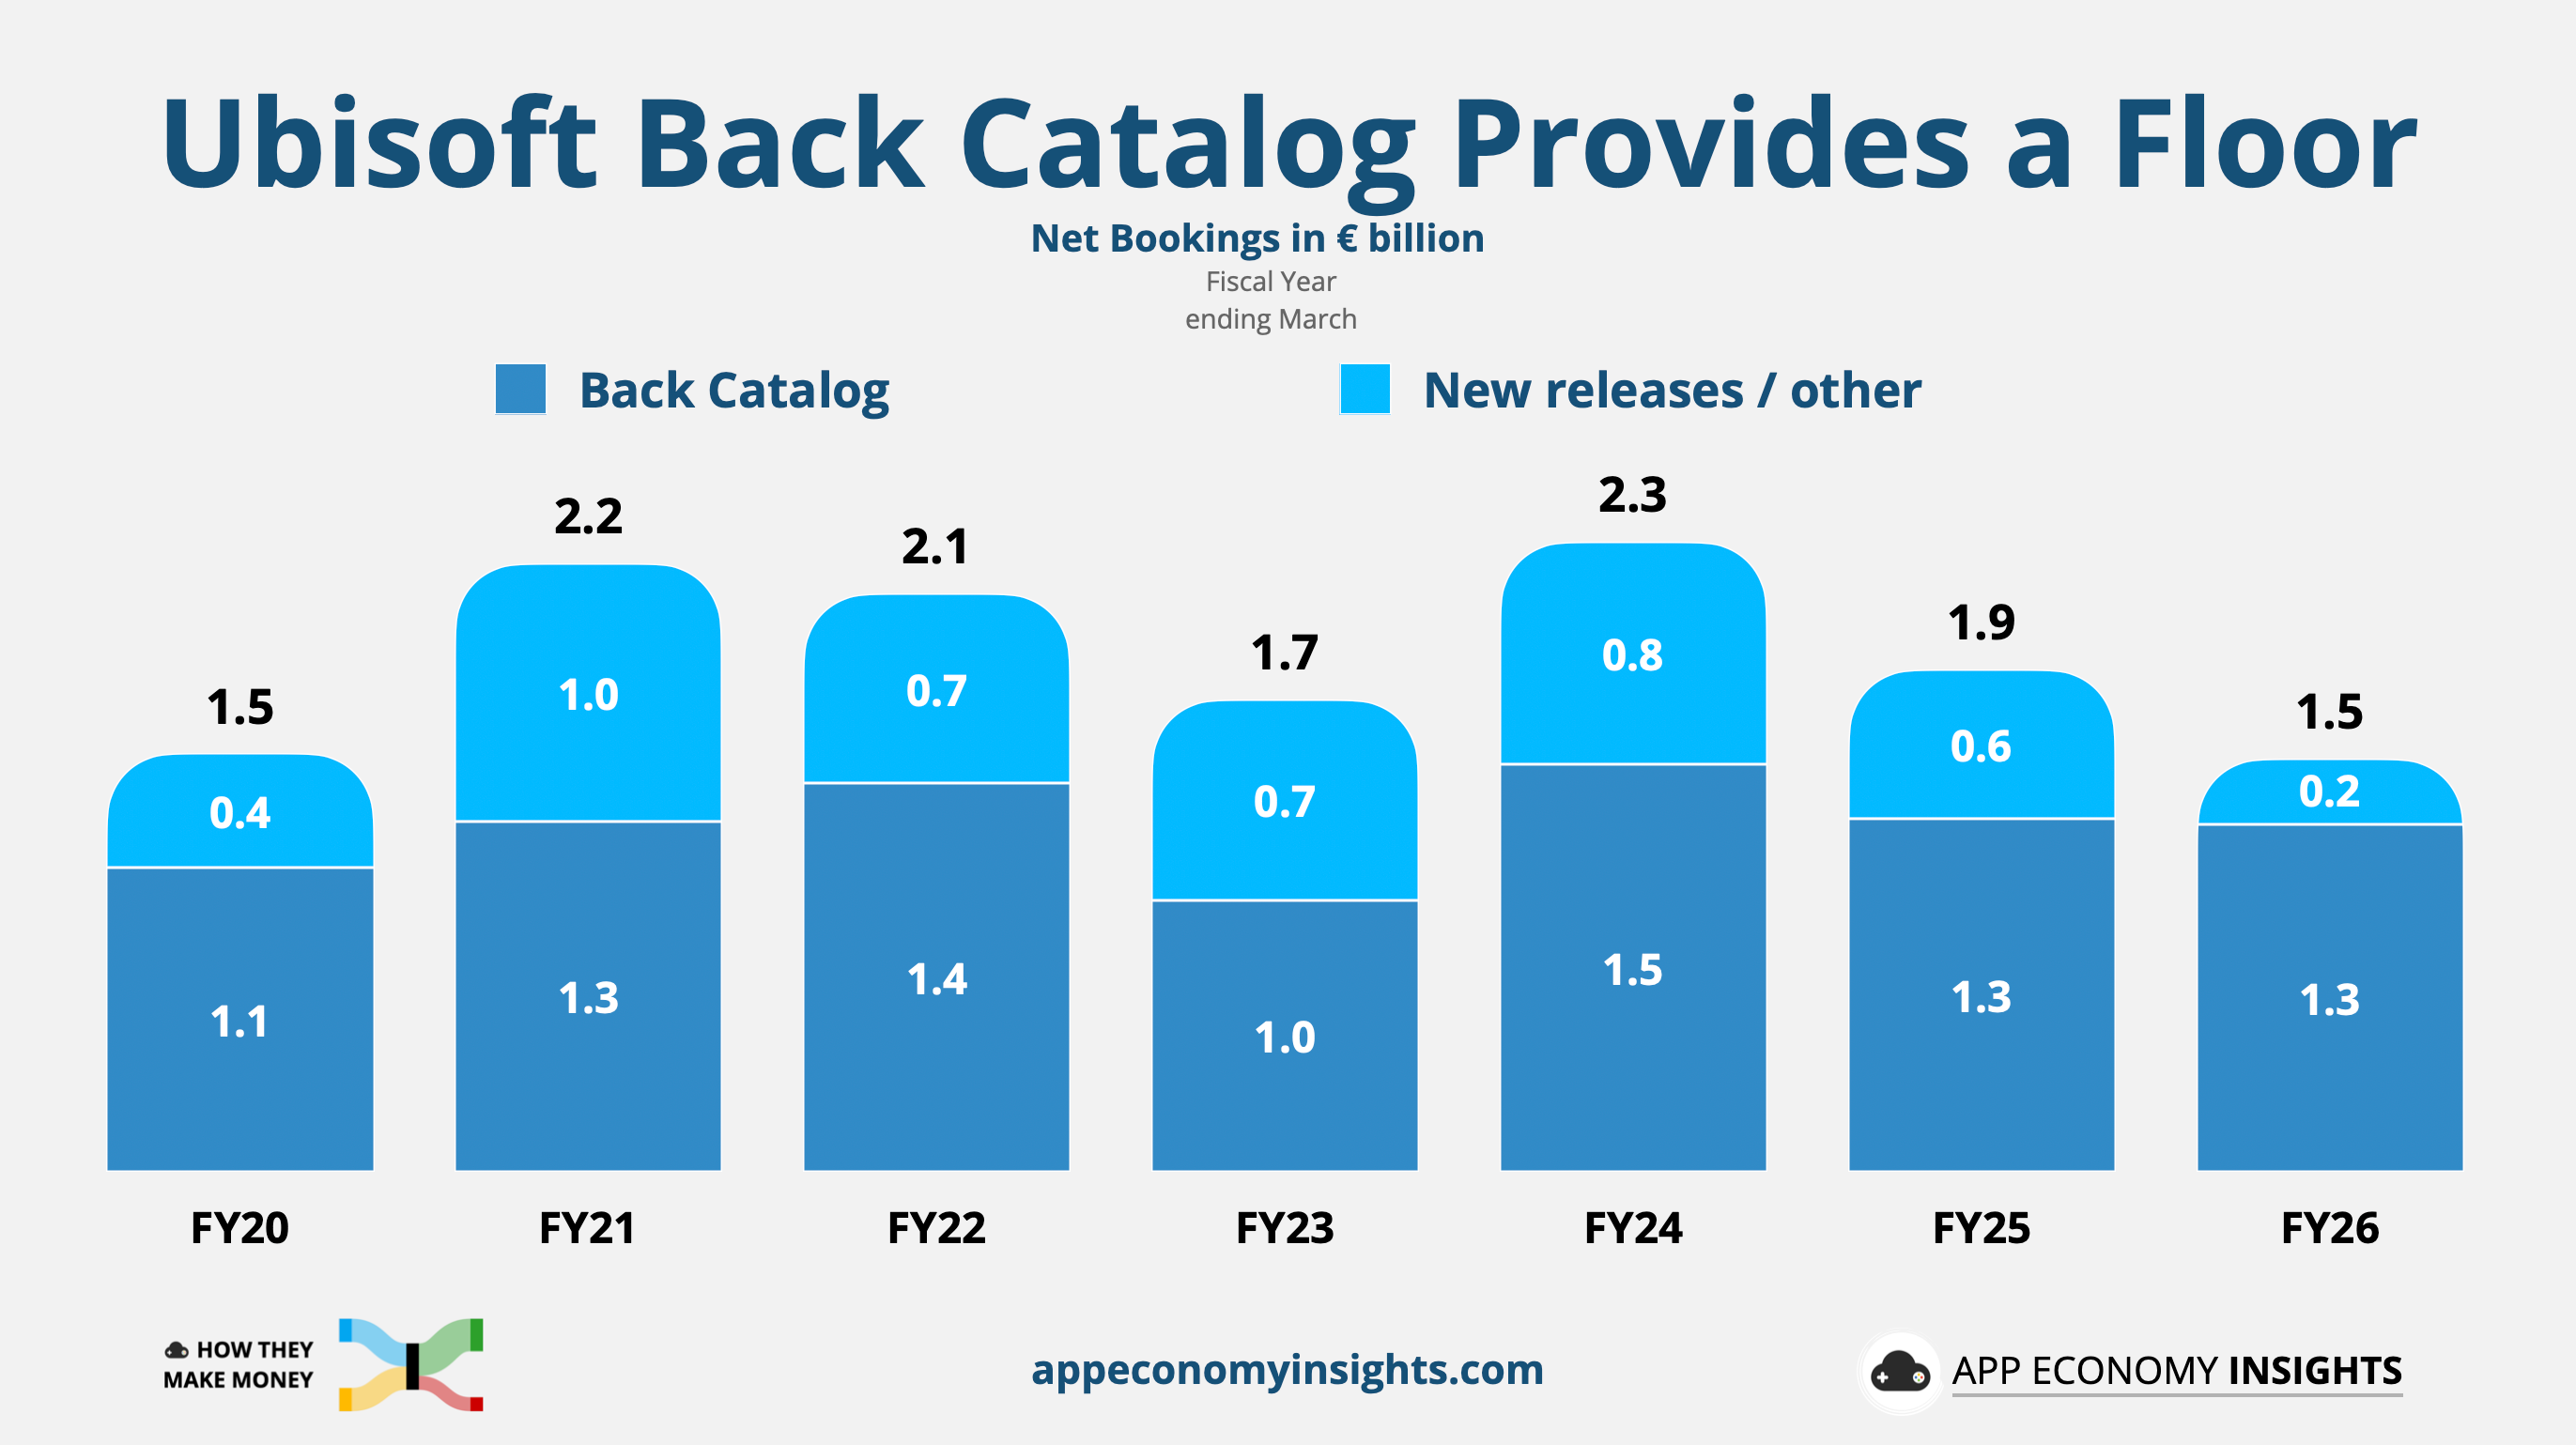
In FY26 (ending in March), Ubisoft’s back catalog generated €1.3 billion in net bookings, compared with just €0.2 billion from new releases and other revenue. That’s 84% of the entire business running on games released in previous years. It illustrates the durability of a digital catalog library that gives the company a revenue floor, even without new tentpole releases. The disc-free future acts as a tailwind for this revenue line, with no second-hand market eating away at the long tail of legacy franchises.
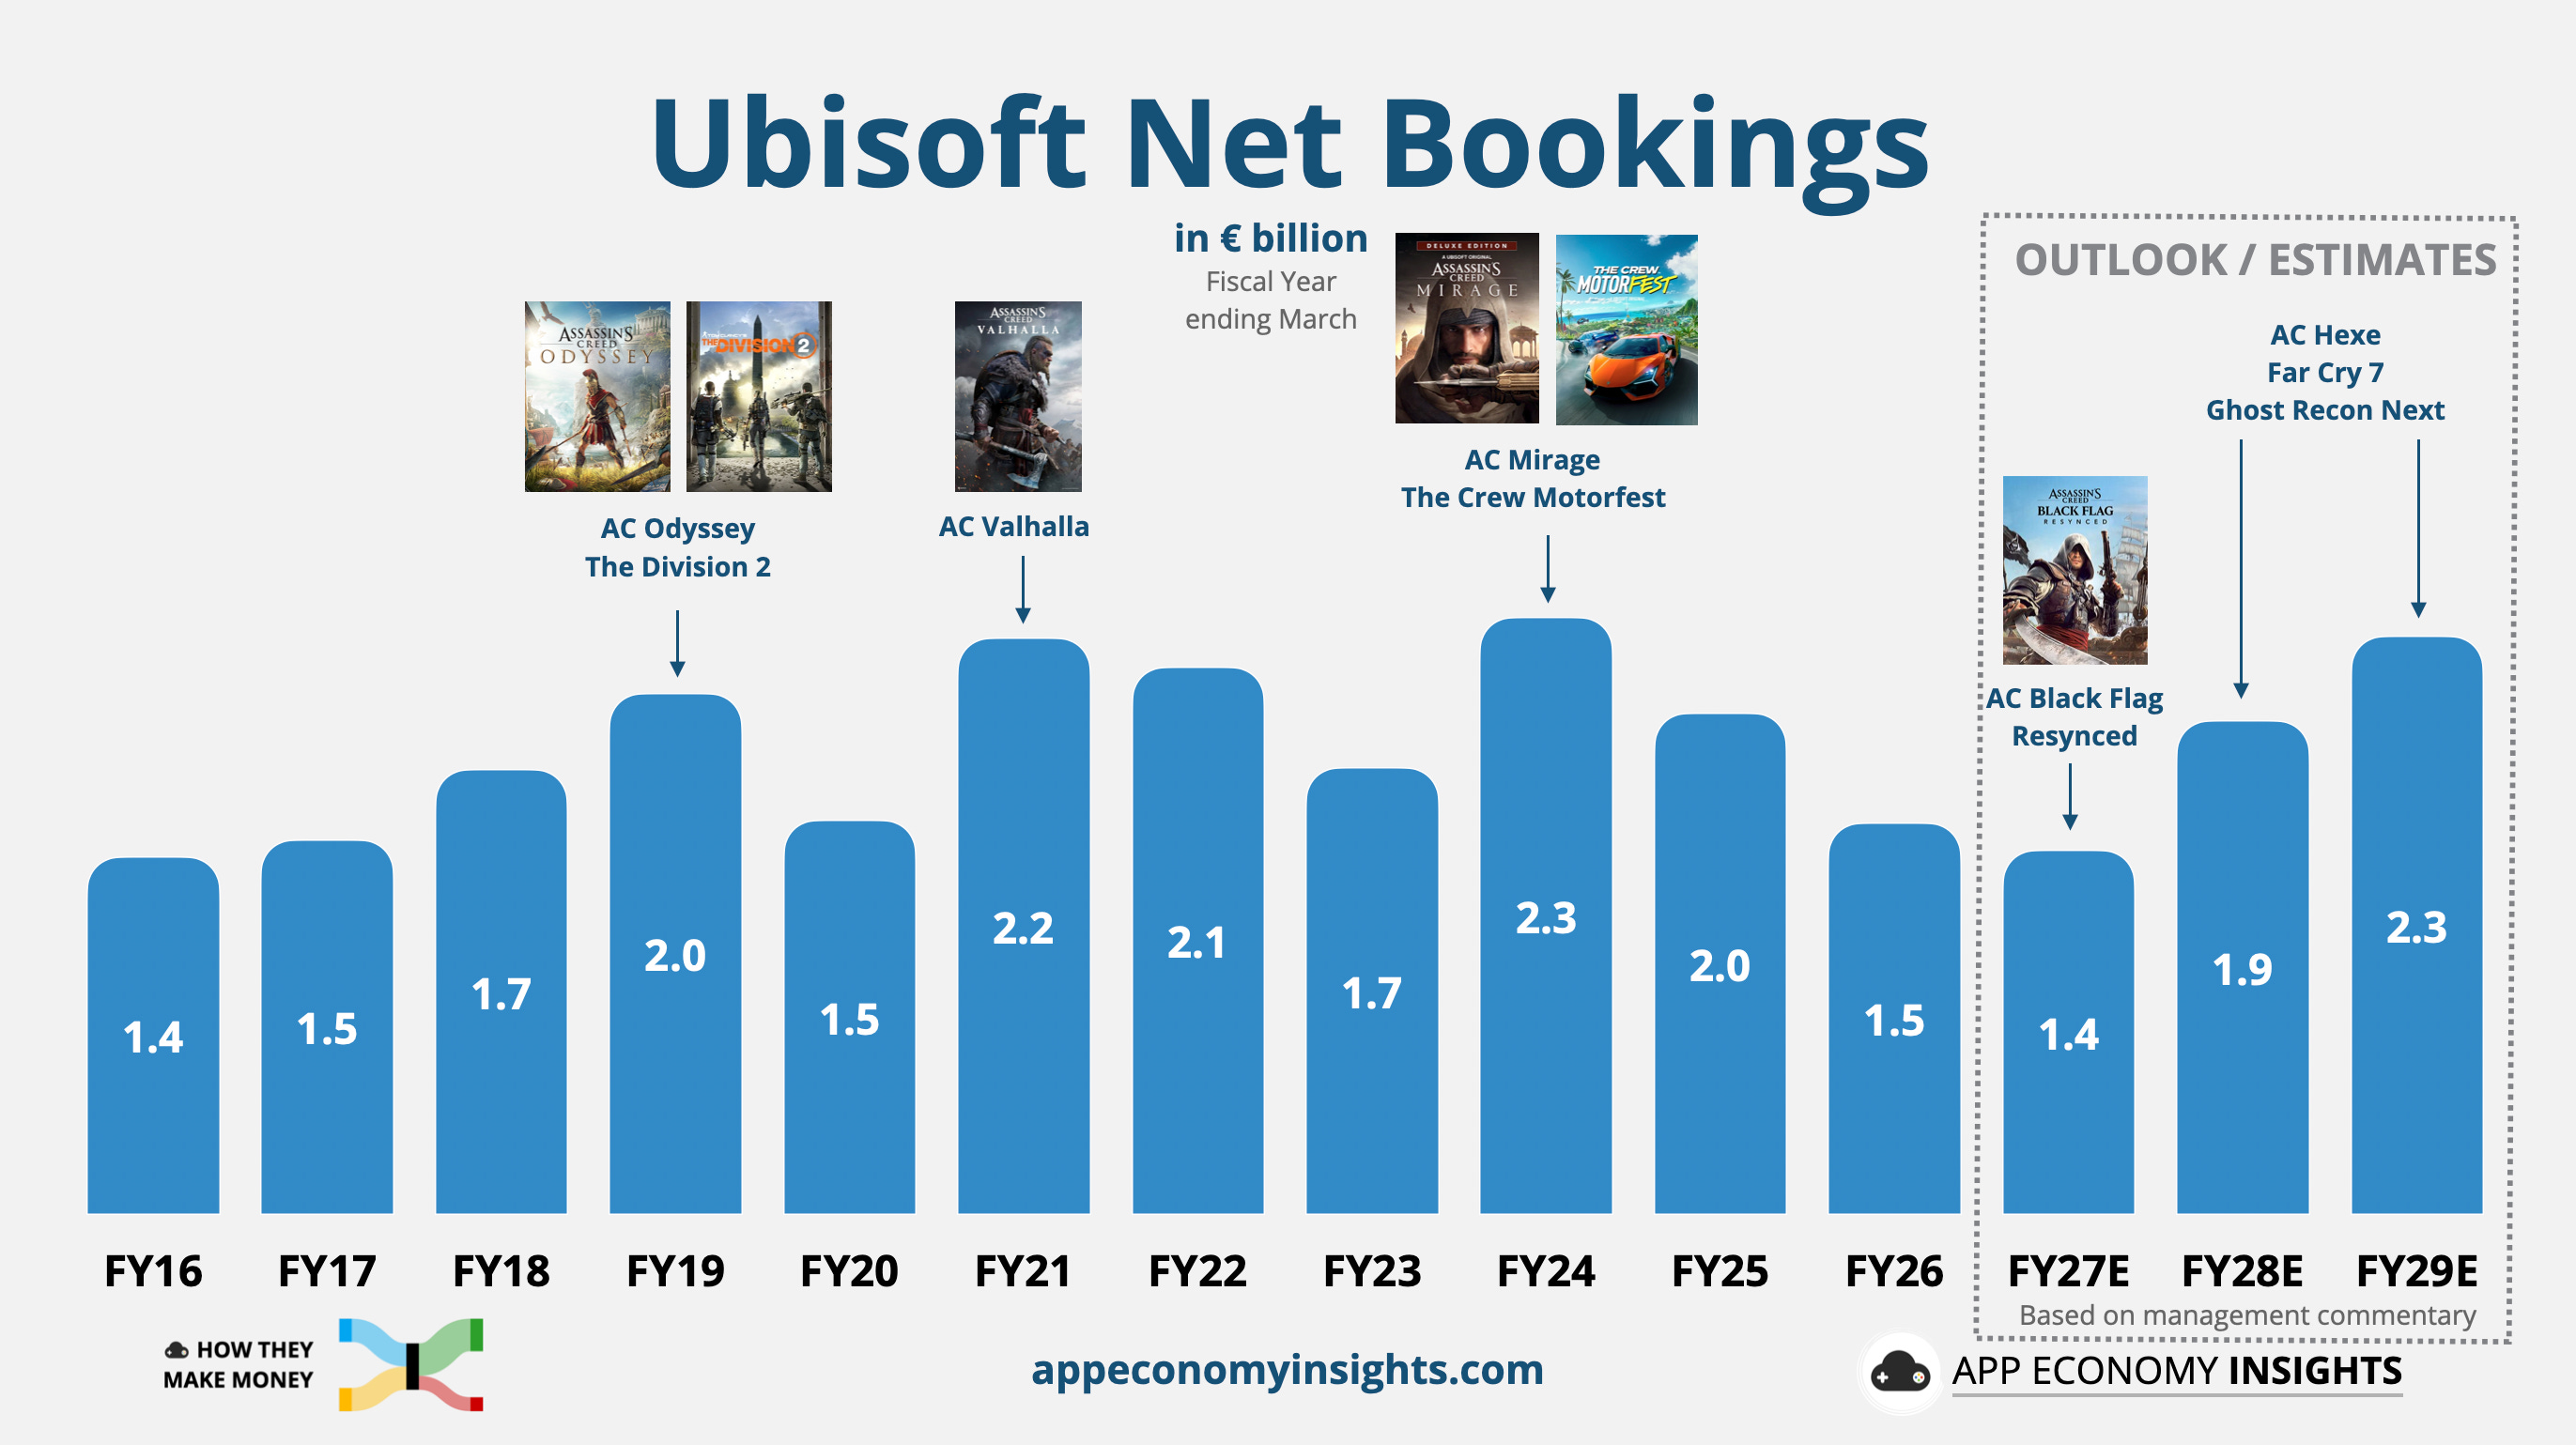
FY24: Net bookings peaked at €2.3 billion, driven by Assassin’s Creed Mirage and The Crew Motorfest, with strong back-catalog performance.
FY26: Net bookings fell to €1.5 billion, with no notable new releases.
FY27: Guidance for the fiscal year that started in April points to a high-single-digit decline, implying roughly €1.4 billion in net bookings. Black Flag Resynced is the main new release, and Ubisoft’s guidance appears to leave room for upside. The game does not need to be a massive blockbuster to improve the narrative. That is the advantage of low expectations.
Ubisoft plans for a rebound in FY28 and FY29, when management expects to ship Assassin’s Creed Hexe, Far Cry 7, and a new Ghost Recon, lifting bookings closer to the ~€2 billion of previous years. A success for Black Flag Resynced could remind the market that the IP still works. It would certainly be a good idea ahead of a Netflix tie-up with an Assassin’s Creed show expected in the coming months. The main risk ahead is that the upcoming games could be postponed if the quality is not there, leaving the company in a cash flow hole.
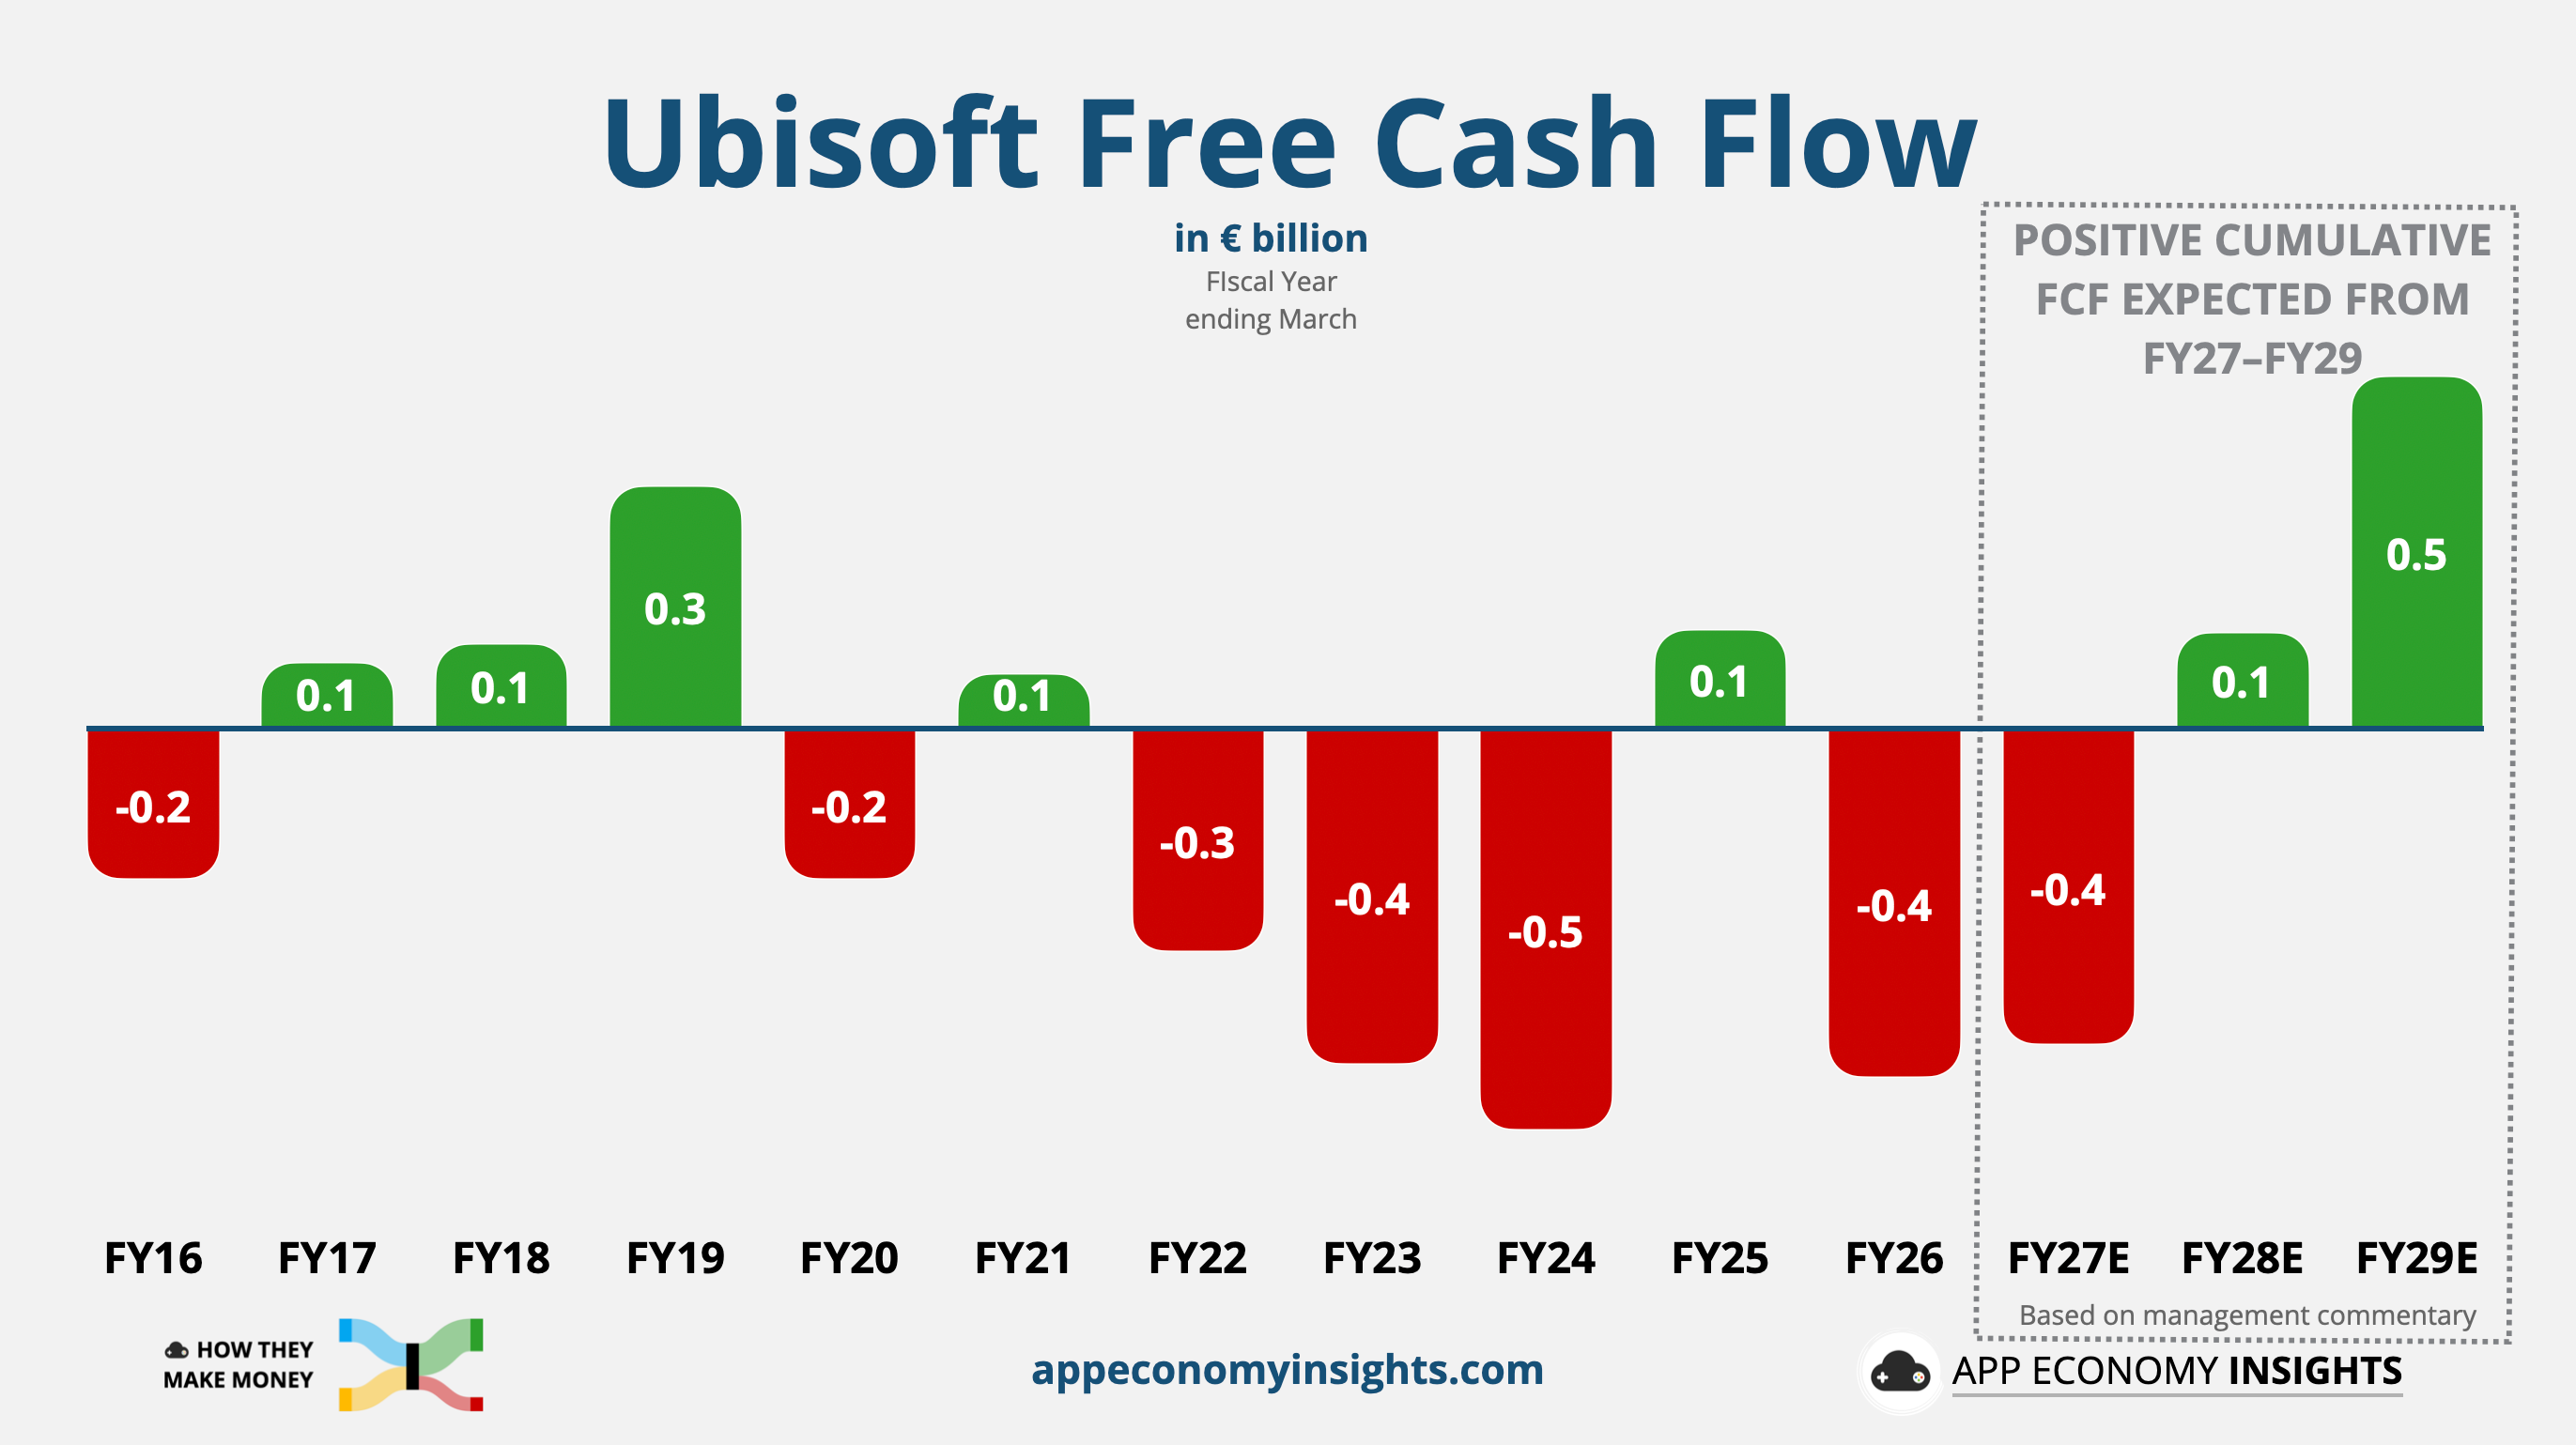
Free cash flow has been negative in four of the last five fiscal years, including -€0.5 billion in FY24 and -€0.4 billion in FY26. Management already stated that free cash flow consumption in FY27 will be no more than -€0.5 billion, but that’s a low bar.
On the bright side, Ubisoft expects cumulative free cash flow to turn positive from FY27 through FY29. That would be good news for liquidity and solvency. But that inflection point still depends on a set of games to actually launch over that period.
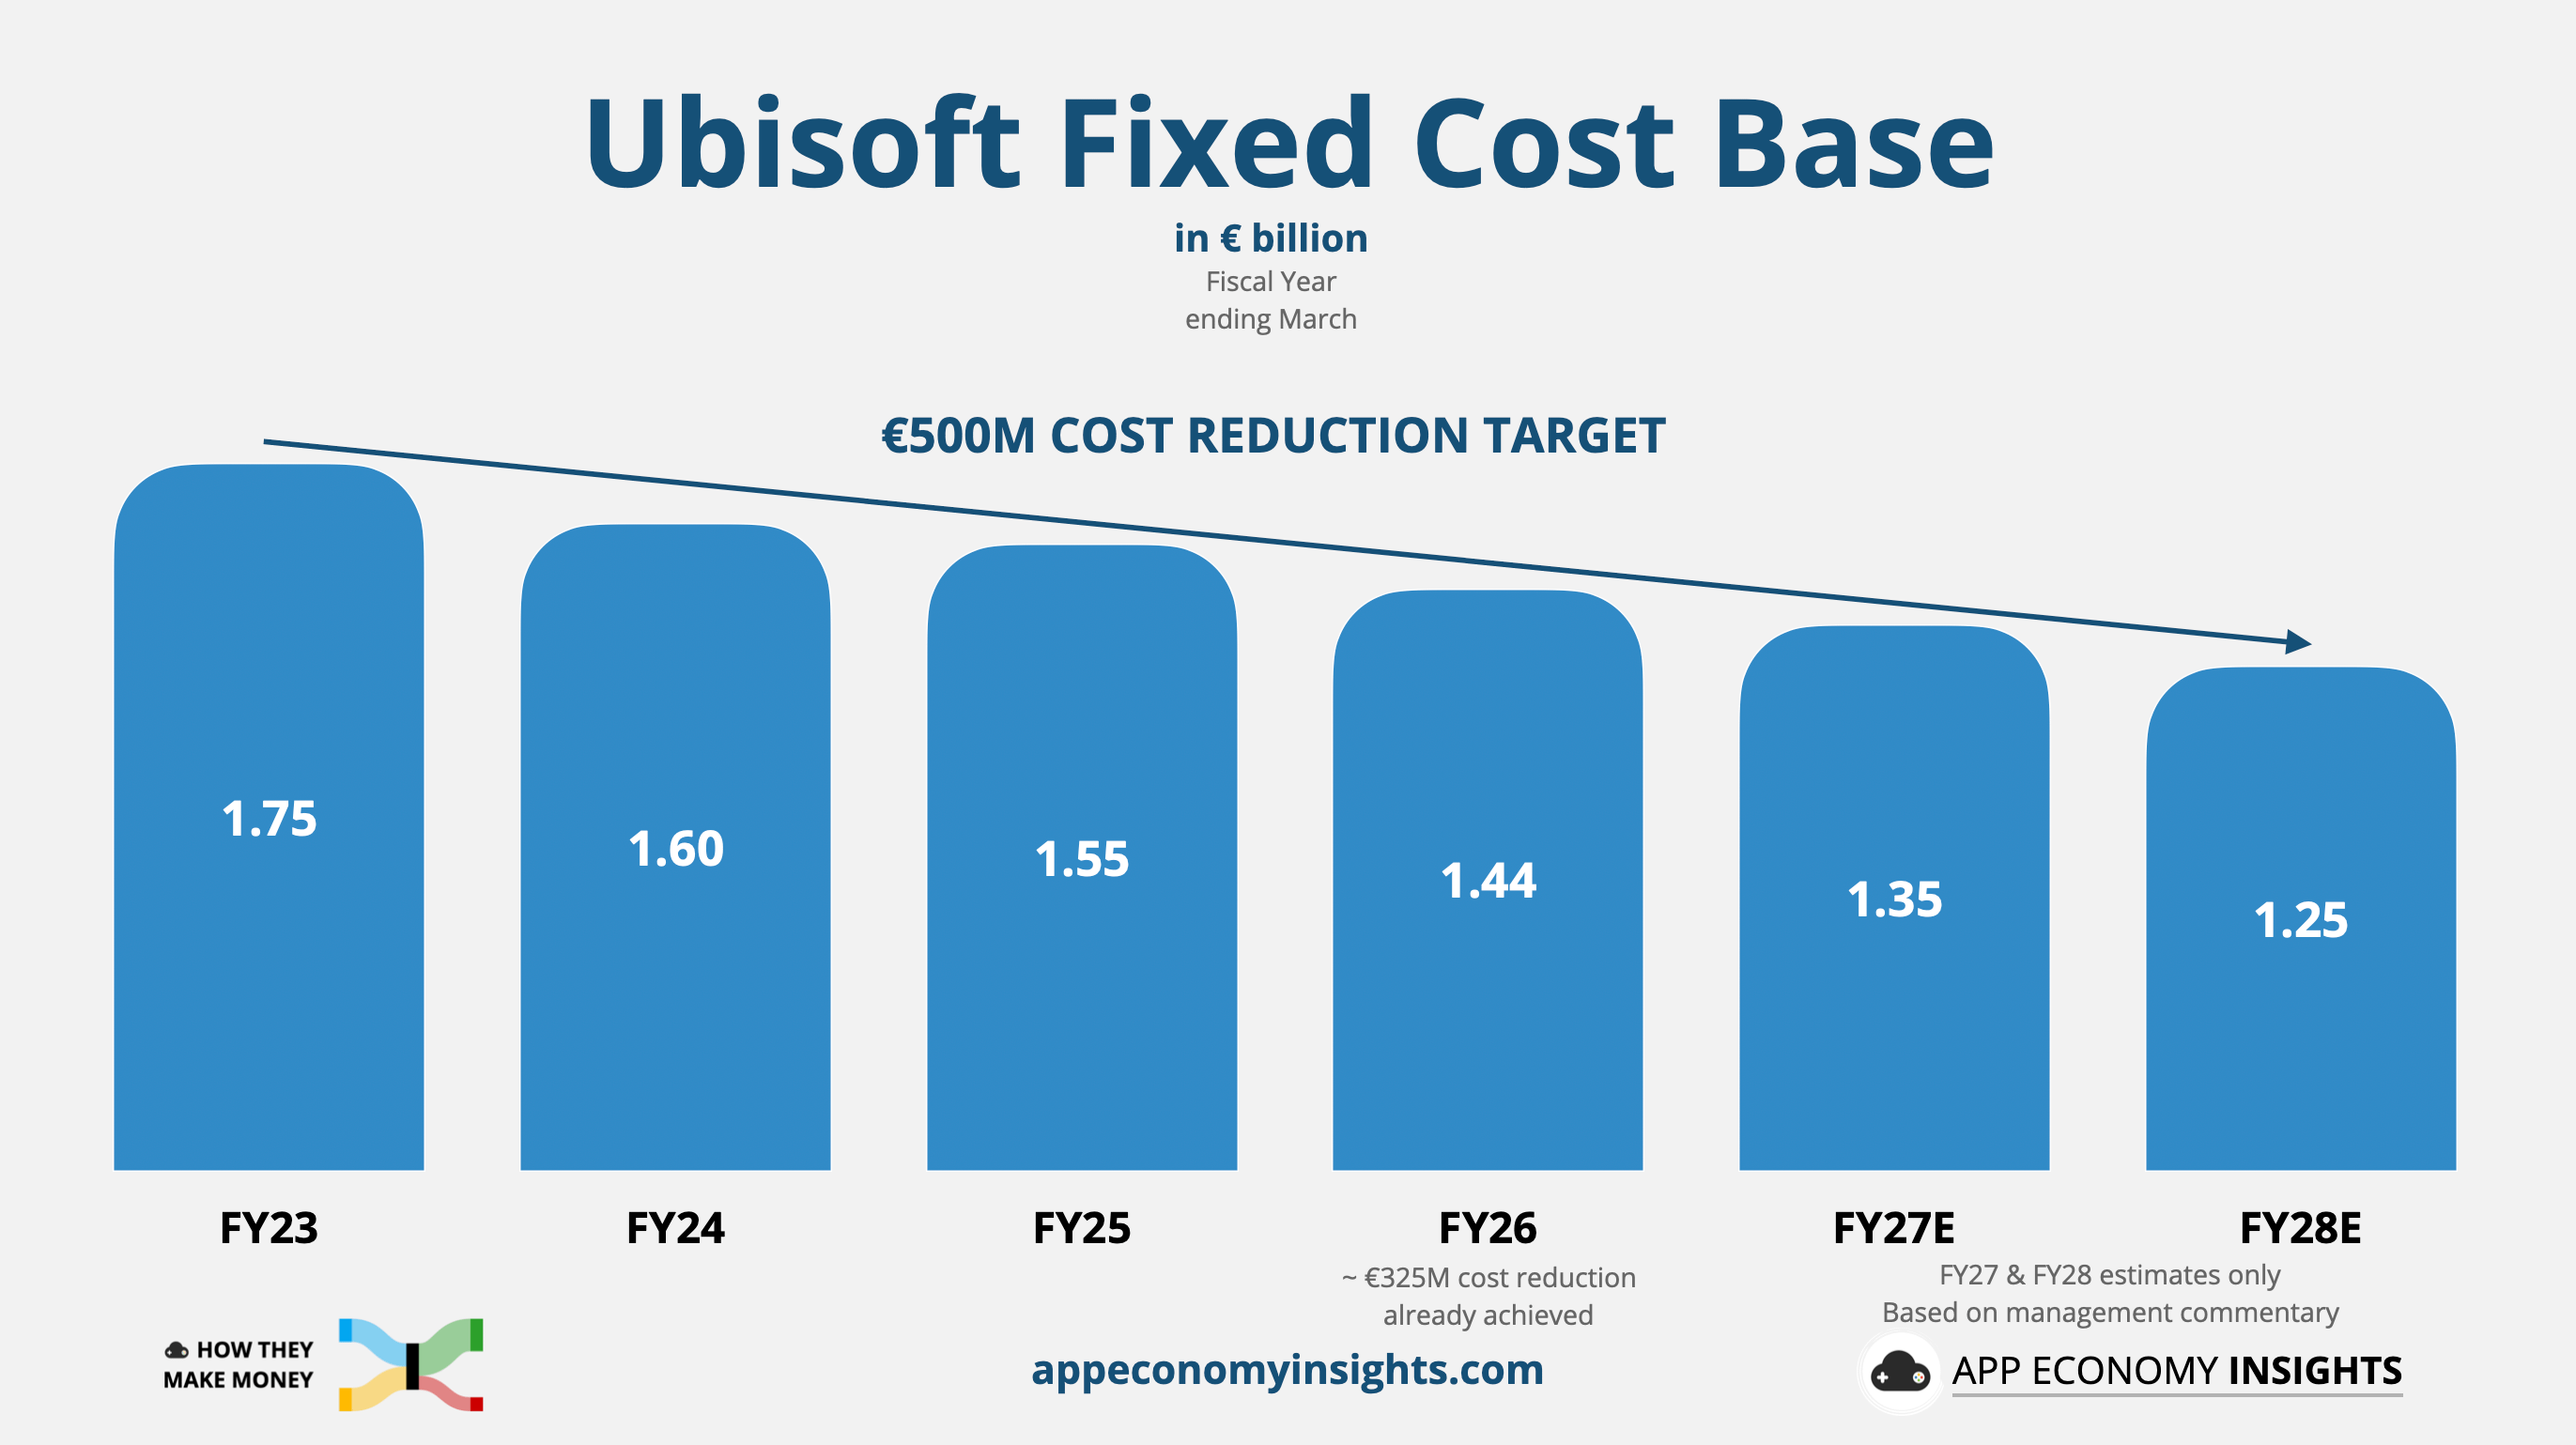
To achieve such a rebound, Ubisoft has been cutting fixed costs aggressively, reducing them from €1.75 billion in FY23 to €1.44 billion in FY26. The target is €1.25 billion by the end of FY28. Whatever happens to bookings, Ubisoft is guiding to a structurally smaller cost base than the one that burned through FY23 and FY24. To do so, they have reduced their workforce from ~20,000 to roughly ~16,000.
The cost reset lowers the hurdle, but it does not solve the problem on its own. Ubisoft still needs enough successful releases to spread that smaller cost base over the same bookings pool.
The market factors a solvency risk: It also assumes the company may face significant dilution if it needs to raise capital to meet near-term obligations. The catalog is de-risked, but there is no margin of safety for the next few high-profile titles. Ubisoft still has to navigate near-term debt maturities while proving that FY27 is the trough and FY28/FY29 can restore positive cash flow.
There is an asymmetric upside if FCF rebounds: Sub-1x EV/bookings against a back catalog this large only makes sense if the market expects the catalog itself to erode. But the back-catalog net bookings trend suggests the portfolio has been very resilient and that only one high-profile game per year is needed to keep the company in the black moving forward, which seems like a very low bar for ~16,000 employees.
Tencent put a real price on the crown jewels: The minority stake in Vantage Studios signals that Tencent sees value in the main IPs and studios. That value was €3.8 billion just a few months ago.
A challenging history: Ubisoft has been plagued with toxic workplace allegations, game controversies, repeated delays, and the founding Guillemot family keeps tight control, with family members placed in key leadership positions.
Bottom Line: Ubisoft doesn’t need a miracle. FY27 guidance looks conservative, the catalog still produces more than €1 billion a year, and fixed costs are finally moving lower. But the company still needs to ship the next major slate by March 2029 and prove the new cost base can turn bookings into cash. At 0.6x average net bookings, the market is not paying for that yet. After years of delays, cancellations, and uneven launches, execution remains the hard part. If cash burn persists, the balance sheet becomes the only story that matters.
That's it for today.
Happy investing!
Thanks to Fiscal.ai for being our official data partner. Create your own charts and pull key metrics from 50,000+ companies directly on Fiscal.ai. Save 15% with this link.
Disclosure: I own AAPL, GOOG, META, and TCEHY in App Economy Portfolio. I also personally own UBSFY. I share my ratings (BUY, SELL, or HOLD) with App Economy Portfolio members.
Author's Note (Bertrand here 👋🏼): The views and opinions expressed in this newsletter are solely my own and should not be considered financial advice or any other organization's views.
2026-07-07 20:01:23
Welcome to the Premium edition of How They Make Money.
Over 300,000 subscribers turn to us for business and investment insights.
In case you missed it:

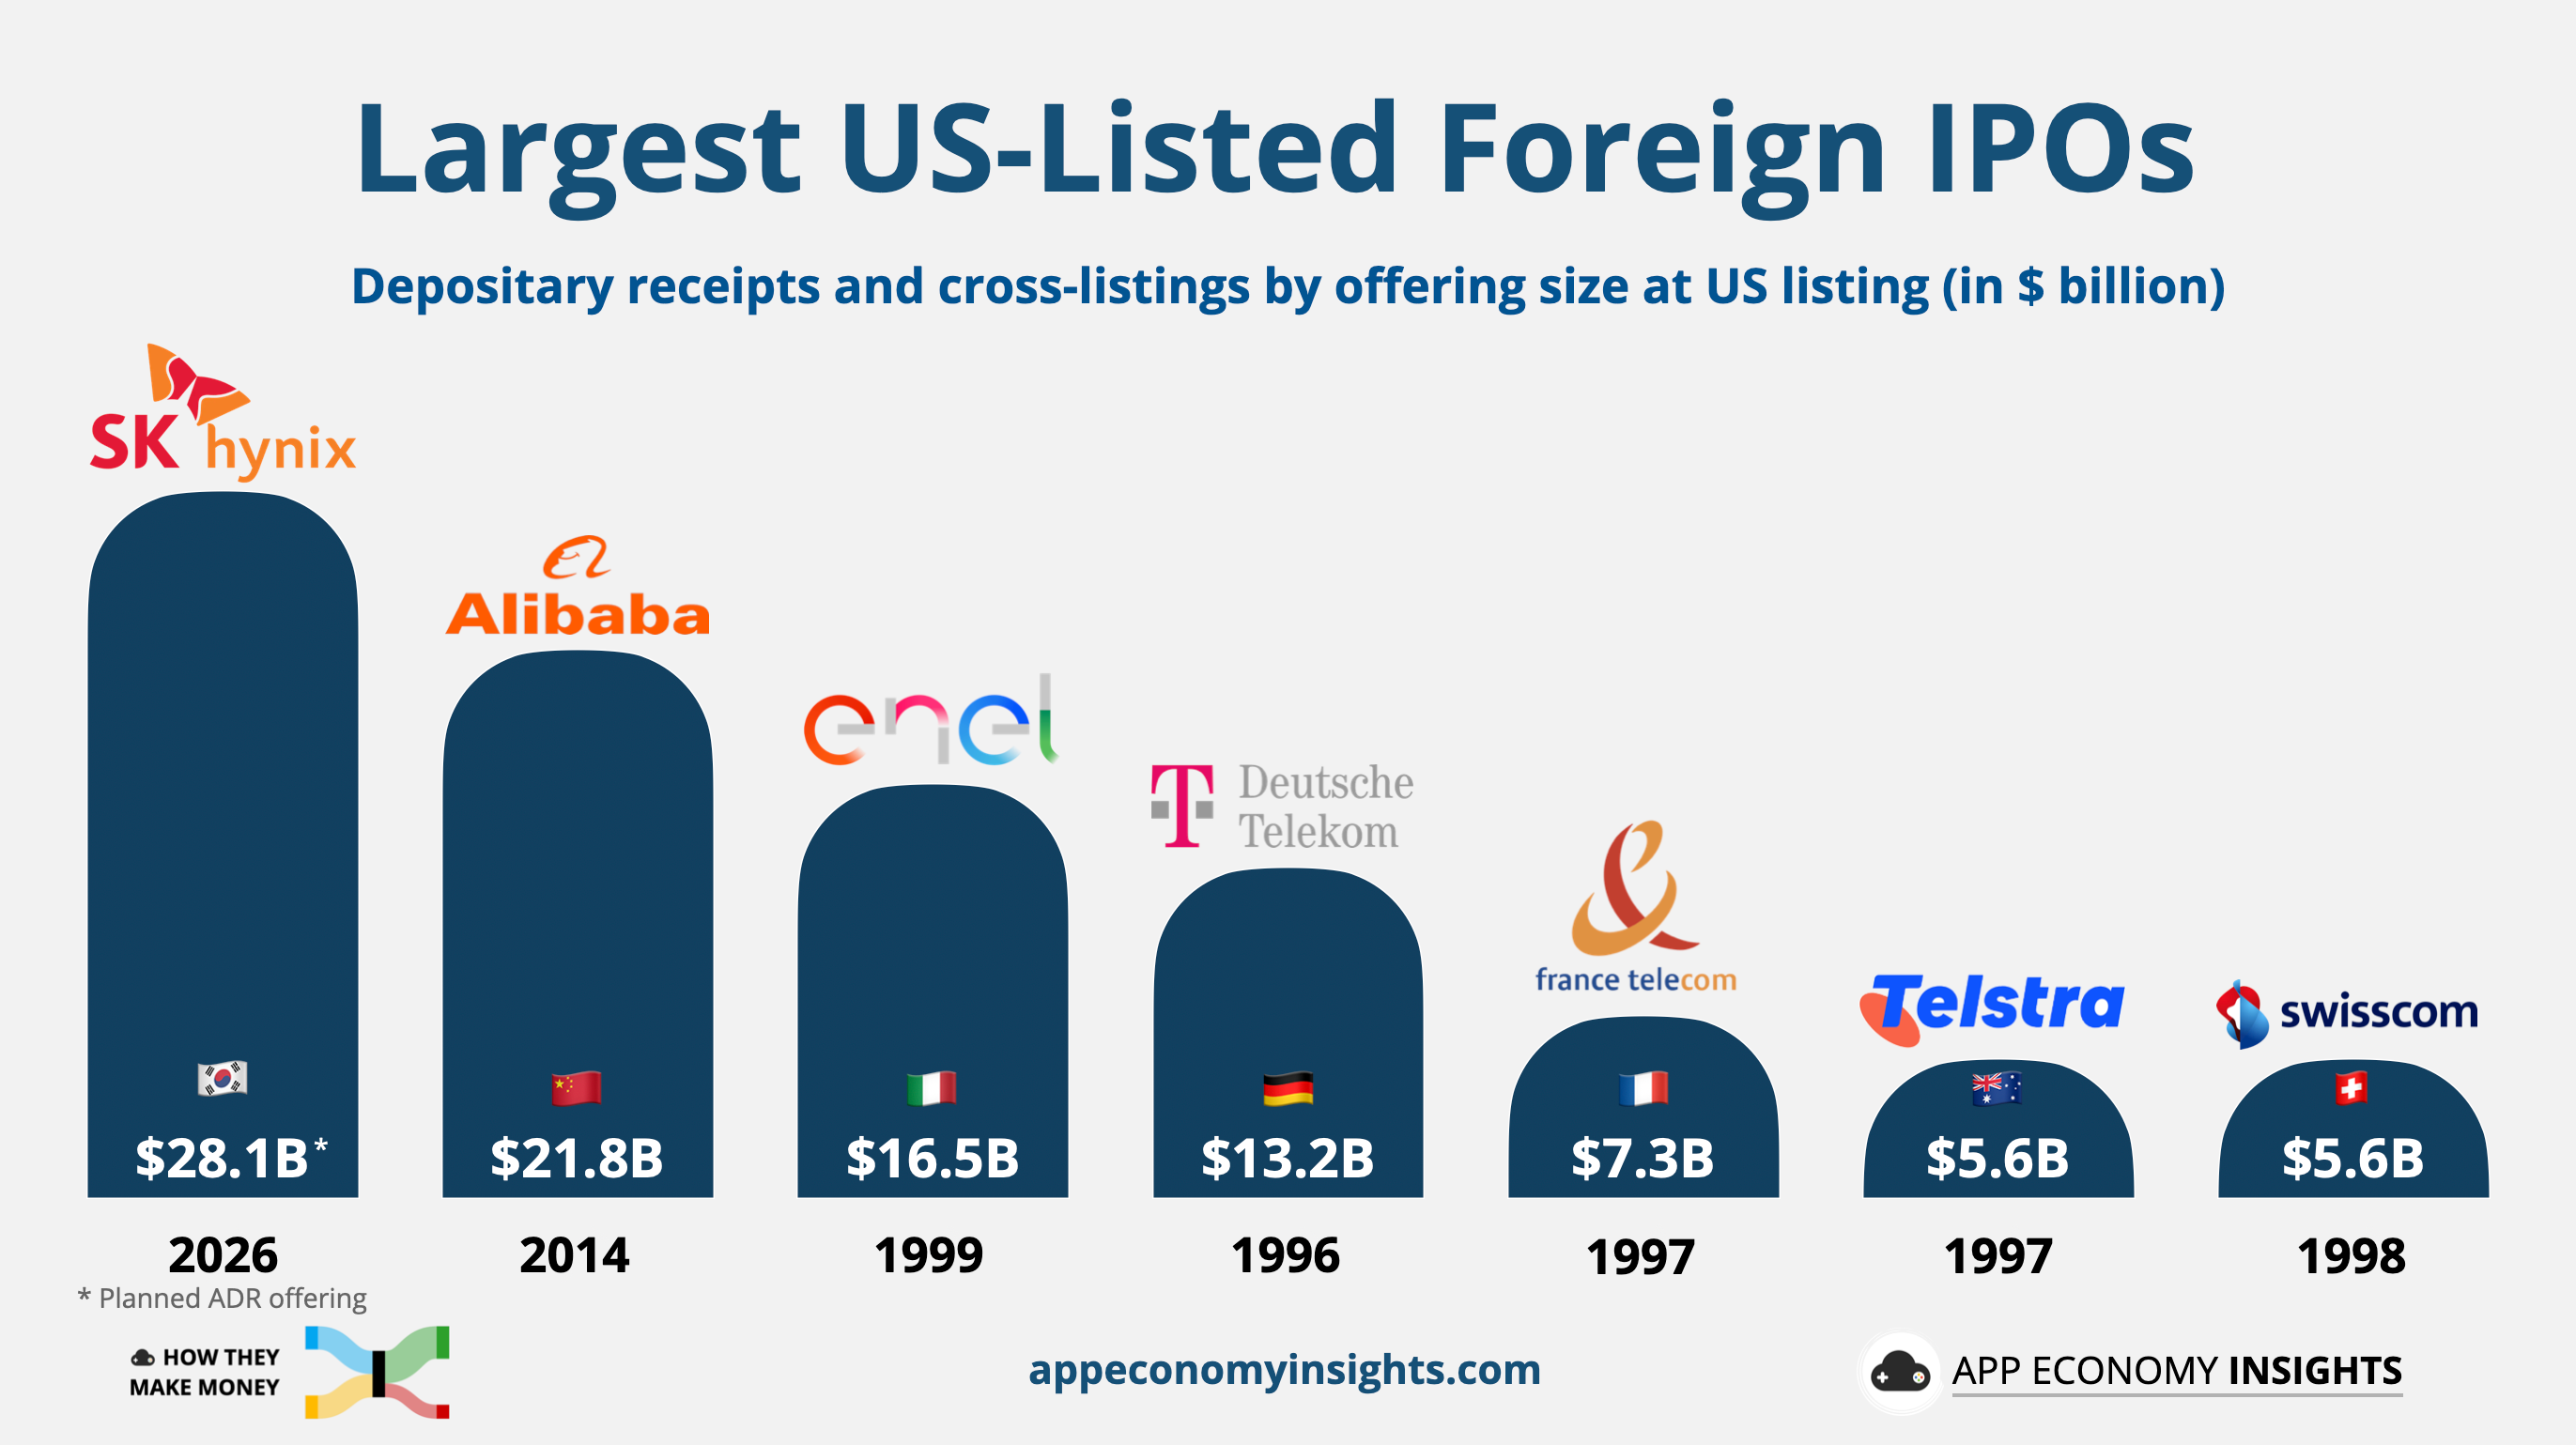
SK Hynix is trying to pull off the largest ADR listing in history.
The planned Nasdaq listing targets over $28 billion (45 trillion won), edging past Alibaba’s ~$22 billion New York debut in 2014. Trading is expected to begin around July 10. Every dollar is earmarked for fabs, packaging, and lithography machines. The funny part is that the company doesn’t really need the money.
SK Hynix is the world’s #1 HBM maker (High Bandwidth Memory) at ~57% share. The company sold out of capacity three years in advance, and it just surpassed Samsung to become South Korea’s most valuable company. It also already trades right in line with Micron, near 7x forward earnings. The re-rating a Nasdaq listing is supposed to deliver already happened.
We broke down Micron’s blowout quarter last week, noting that the company benefited from the AI memory shortage.
This week, the leader that ships the majority of NVIDIA's HBM is asking US investors to price it like the AI infrastructure play it has become.
Today at a glance:
📈 The US Listing
🧠 How SK Hynix Makes Money
📊 Q1 FY26 in Numbers
🇰🇷 What You're Paying
⚔️ Competition & Risks
🔭 What to Watch
🧭 Personal Take
SK Hynix shares trade in Seoul, in won, on the Korea Exchange. That makes them awkward and expensive for US institutions to touch directly. An American Depositary Receipt (ADR) solves that. The company issues new shares, parks them with a custodian bank, and a US depositary issues receipts that trade on Nasdaq in dollars like any American stock.
SK Hynix plans to issue up to 178 million ADRs, the equivalent of 2.5% of the company. Each Seoul share trades near $1,580 (₩2,425,000) and splits into ten ADRs, so a single ADR is referenced at around $158 (₩242,500), with the final price set on July 10. The ADRs list on the Nasdaq Global Select Market under SKHY.
Every dollar is going into capacity.
The proceeds are split four ways:
🏭 Yongin Y1: the first fab at SK Hynix’s sprawling new Yongin cluster, its next major DRAM and HBM base.
📦 Cheongju P&T7: an advanced packaging plant built for HBM, where the die-stacking that sets SK Hynix apart actually happens.
🔬 ASML EUV scanners: the extreme-ultraviolet lithography tools that leading-edge DRAM can’t be made without.
🇺🇸 Indiana: a $4 billion packaging plant, SK Hynix’s first US fab.
Compare that to the SpaceX IPO. SpaceX is raising funds for its CapEx ramp, with $10 billion in negative free cash flow in Q1 alone. SK Hynix is raising money from a position of strength, with $24 billion in net cash and an order book sold out through 2028.
SK Hynix first floated a raise of around $10 billion, and the board eventually settled on $28 bllion. You don’t do that unless internal demand forecasts have moved well past the old memory-cycle playbook.
There’s a control wrinkle worth mentioning. SK Square, the holding company that owns ~20% of SK Hynix, must keep its stake above 20% under Korea’s holding-company rules. That constraint is why the deal issues new shares sized to protect that floor, rather than selling treasury stock. Some Korean shareholders are unhappy about the dilution. For US investors, the dilution is the price of admission to a stock they couldn’t easily buy before.
SK Hynix started in 1983 as Hyundai Electronics, the chip arm of the Korean industrial group. The Asian financial crisis reshaped it. Seoul forced a 1999 merger with rival LG Semicon, creating a top-tier DRAM maker overnight and burying it in debt. When memory prices collapsed ~80% in 2001, the renamed Hynix lost billions, fell under creditor control, and became a national symbol of corporate failure.
2026-07-03 20:02:41
Welcome to the Free edition of How They Make Money.
Over 300,000 subscribers turn to us for business and investment insights.
In case you missed it:
Meta has been shunned by the market this year for overspending on AI. But something good might come out of it.
Bloomberg reported Wednesday that Meta is building a cloud business to rent out its excess AI compute, muscling onto turf held by AWS, Azure, and Google Cloud.
Zuck poured hundreds of billions into data centers for his superintelligence dream, but he might have bought more than he needs. The stock surged nearly 10% on the news, as the new business could offset some of that rapidly growing CapEx line.
It wasn’t good news for everyone. CoreWeave fell 13% and Nebius dropped 15%. Meta spent the past year as one of their biggest customers. Now it could turn into a massive new rival.
It also sharpens the question of where we are in the cycle: did Meta overspend, or is Zuck embracing a new strategy?
Starting a cloud business also confirms that Meta expects to have capacity worth selling. The generous read is that Meta is betting demand keeps coming, the same bet Amazon made when it launched AWS nearly two decades ago.
Zuck called it “definitely on the table” back in May, noting outsiders ask to buy Meta’s compute almost every week. The company, spending up to ~$145 billion this year on its own moonshot, now has a Plan B: if superintelligence takes its time, collect rent.
Today at a glance:
🦚 Comcast: The Great Unbundling
👟 Nike: Not a Recovery Yet
Comcast is unwinding the ~$30 billion bet it spent a decade defending.
The company is splitting in two, separating NBCUniversal and Sky into a standalone media business, while the parent keeps broadband, wireless, and Comcast Business.
The stock jumped as much as 17% intraday, its biggest move since 2008, before settling up ~5%. Not bad for a name that was down ~22% on the year going in.
This is the second breakup step in less than a year. In January, Comcast spun off its cable networks (CNBC, USA, MS NOW, Golf Channel) into Versant, which fell 13% on its Nasdaq debut and has traded sideways since. The channels were the appetizer. Now the studios, parks, NBC, Peacock, and Sky are leaving too.
Comcast retains the cash machine: the largest converged network across 65M+ homes, the largest WiFi network, and a fast-growing wireless business in a $200B+ market. Michael Angelakis, the former CFO who helped architect the 2011 NBCUniversal purchase, returns as CEO to run the company now shedding it (you can’t make this up.)
NBCUniversal walks away with the IP: Universal Studios, the theme parks (including Epic Universe), NBC, Telemundo, Bravo, Peacock, and Sky. Co-CEO Mike Cavanagh takes over. Brian Roberts, whose family controls both through a dual-class structure, stays “actively involved” in each.
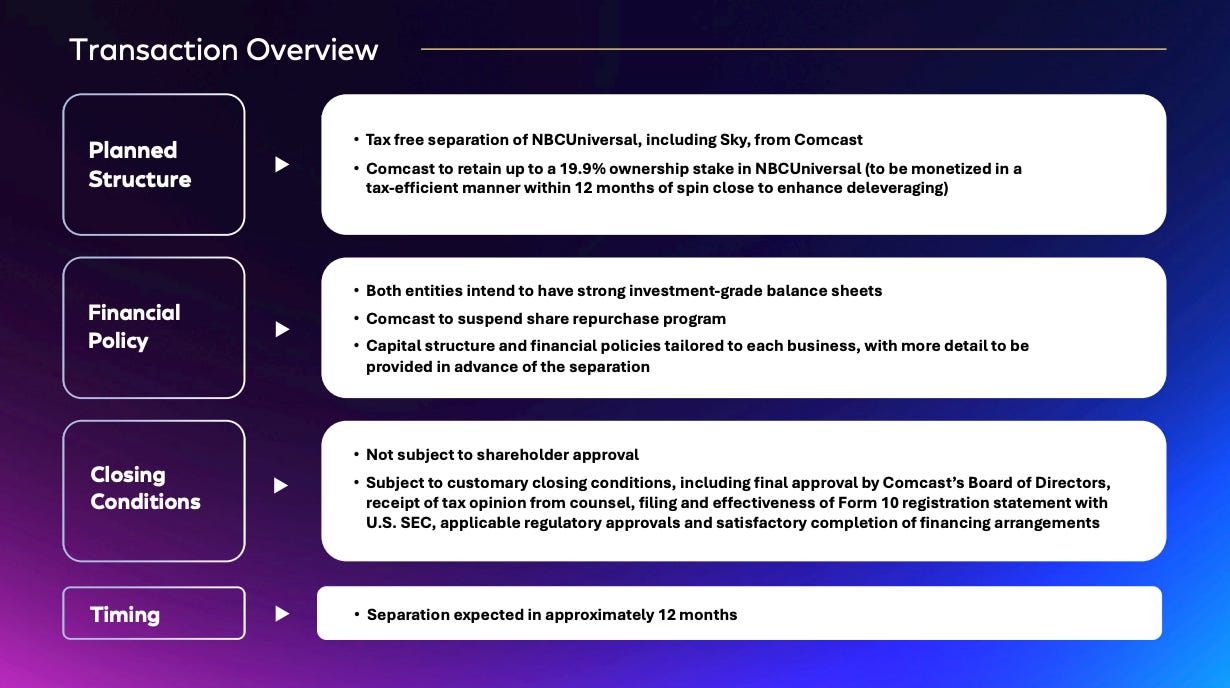
The structure is a tax-free separation in roughly 12 months, with Comcast holding up to a 19.9% stake in NBCUniversal to sell down and cut debt. The buyback is suspended until then.
Q1 made the logic obvious:
Connectivity delclined 1% Y/Y to $20.0 billion, a slow, dependable annuity now under siege from fixed-wireless home internet and Starlink.
Content & Experiences grew +41% Y/Y to $13.0 billion, but only because NBC aired both Super Bowl LX and the Winter Olympics in February. Media revenue spiked +61% Y/Y on events that don't recur next quarter.
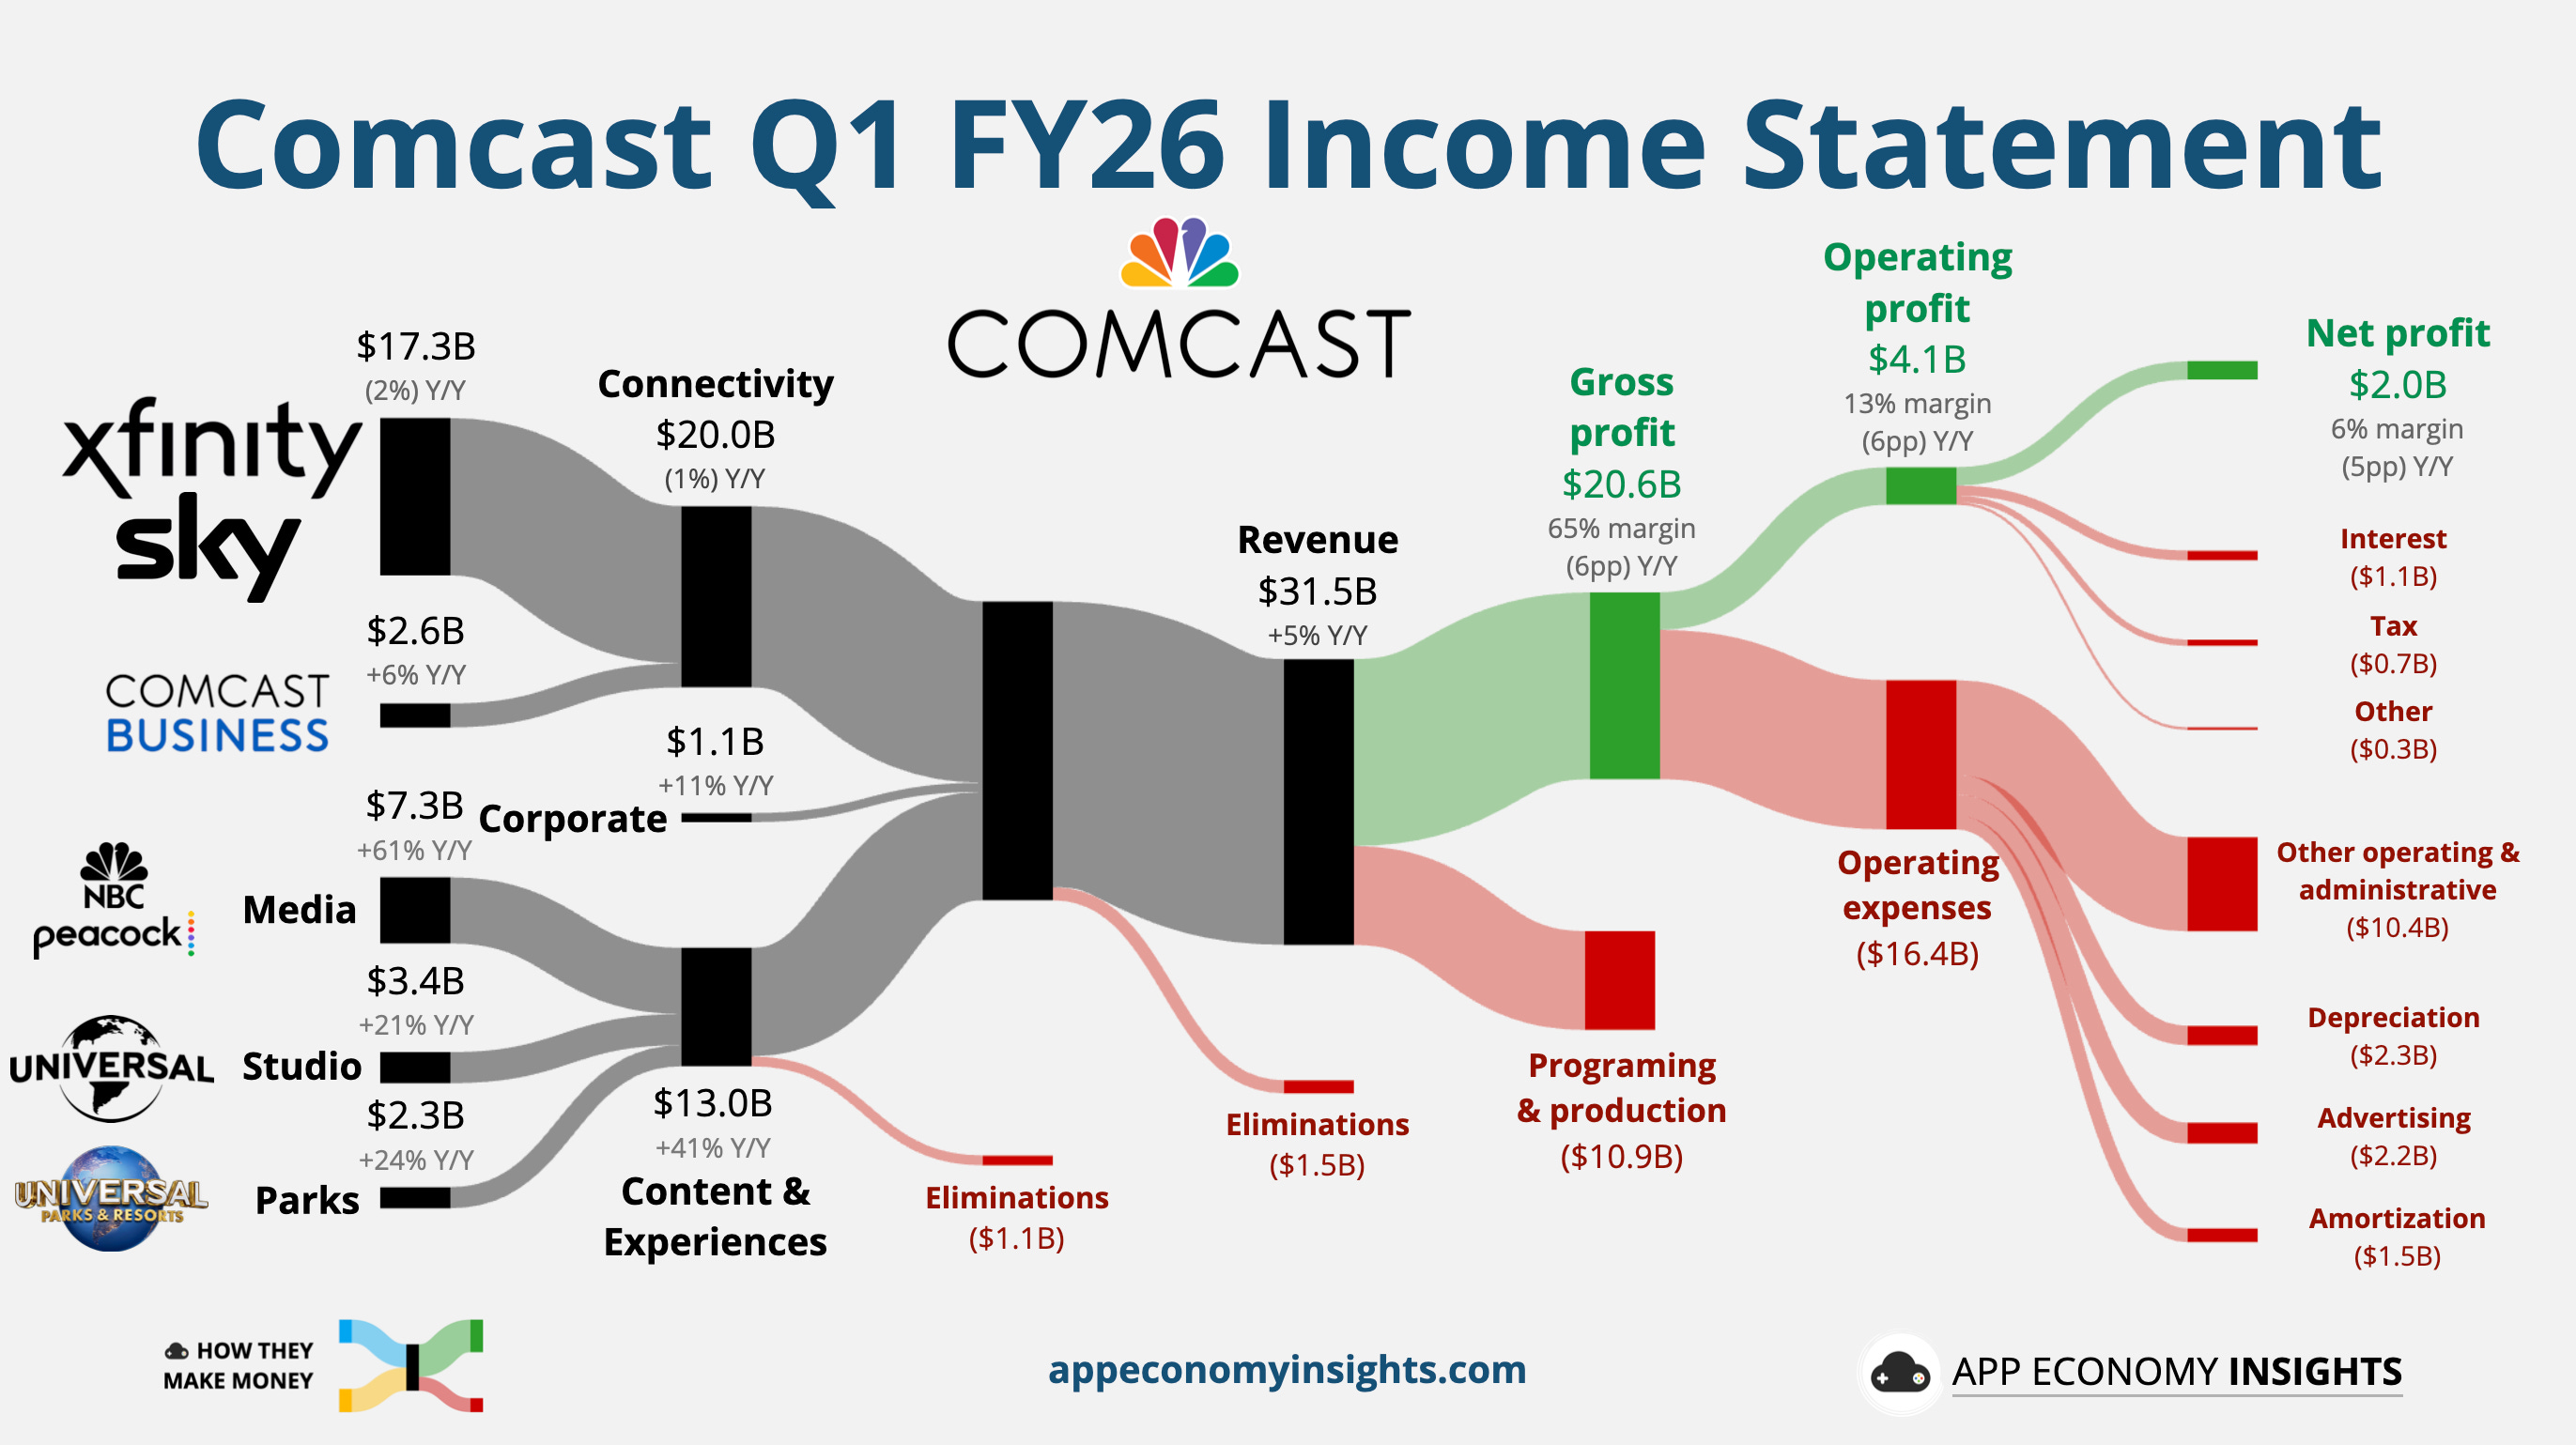
One business is a flat-growth utility throwing off free cash flow. The other is a lumpy, hit-driven content engine. Bundling them blurred the story for two very different investor bases, which is exactly the rationale Comcast now cites. After years of insisting the businesses belonged together, Cavanagh told analysts, “(we) simply changed our mind.”
Management swears it isn’t about future M&A. Roberts called the split “absolutely not” a prelude to deals. Wall Street seems unconvinced. Some analysts argued the separation matters less than what it enables: two focused companies, each with its own equity currency and board, free to pursue transactions that were unthinkable inside the conglomerate. It’s a way to unlock value and a clear ramp to dealmaking.
Wells Fargo pegs the sum-of-the-parts valuation at ~$25 per share, barely above today's price, and says the upside requires a transaction. A standalone NBCUniversal could use its own stock to buy content and reach the scale to fight Netflix and Disney. Or it might become a target itself.
Bottom Line: Comcast just conceded the conglomerate logic of the last decade is dead. The split should sharpen both businesses, but the market is already pricing the sequel. A leaner NBCUniversal, Sky in tow, becomes either the sector's next buyer or its next target the moment the ink dries.
Nike’s fourth quarter initially looked like a breakout. Reported EPS jumped more than 5x to $0.72. But the quarter included a $986 million tariff recovery tied to the International Emergency Economic Powers Act, which added roughly 900 basis points to gross margin. Adjusted for that one-time boost, EPS was closer to $0.20, a modest beat against the $0.13 consensus rather than the blowout the headline suggested.
The business underneath kept shrinking. Revenue fell 1% to $11.0 billion in the May quarter ($120 million beat) and dropped 4% in constant currency, nearly two years into Nike’s turnaround.
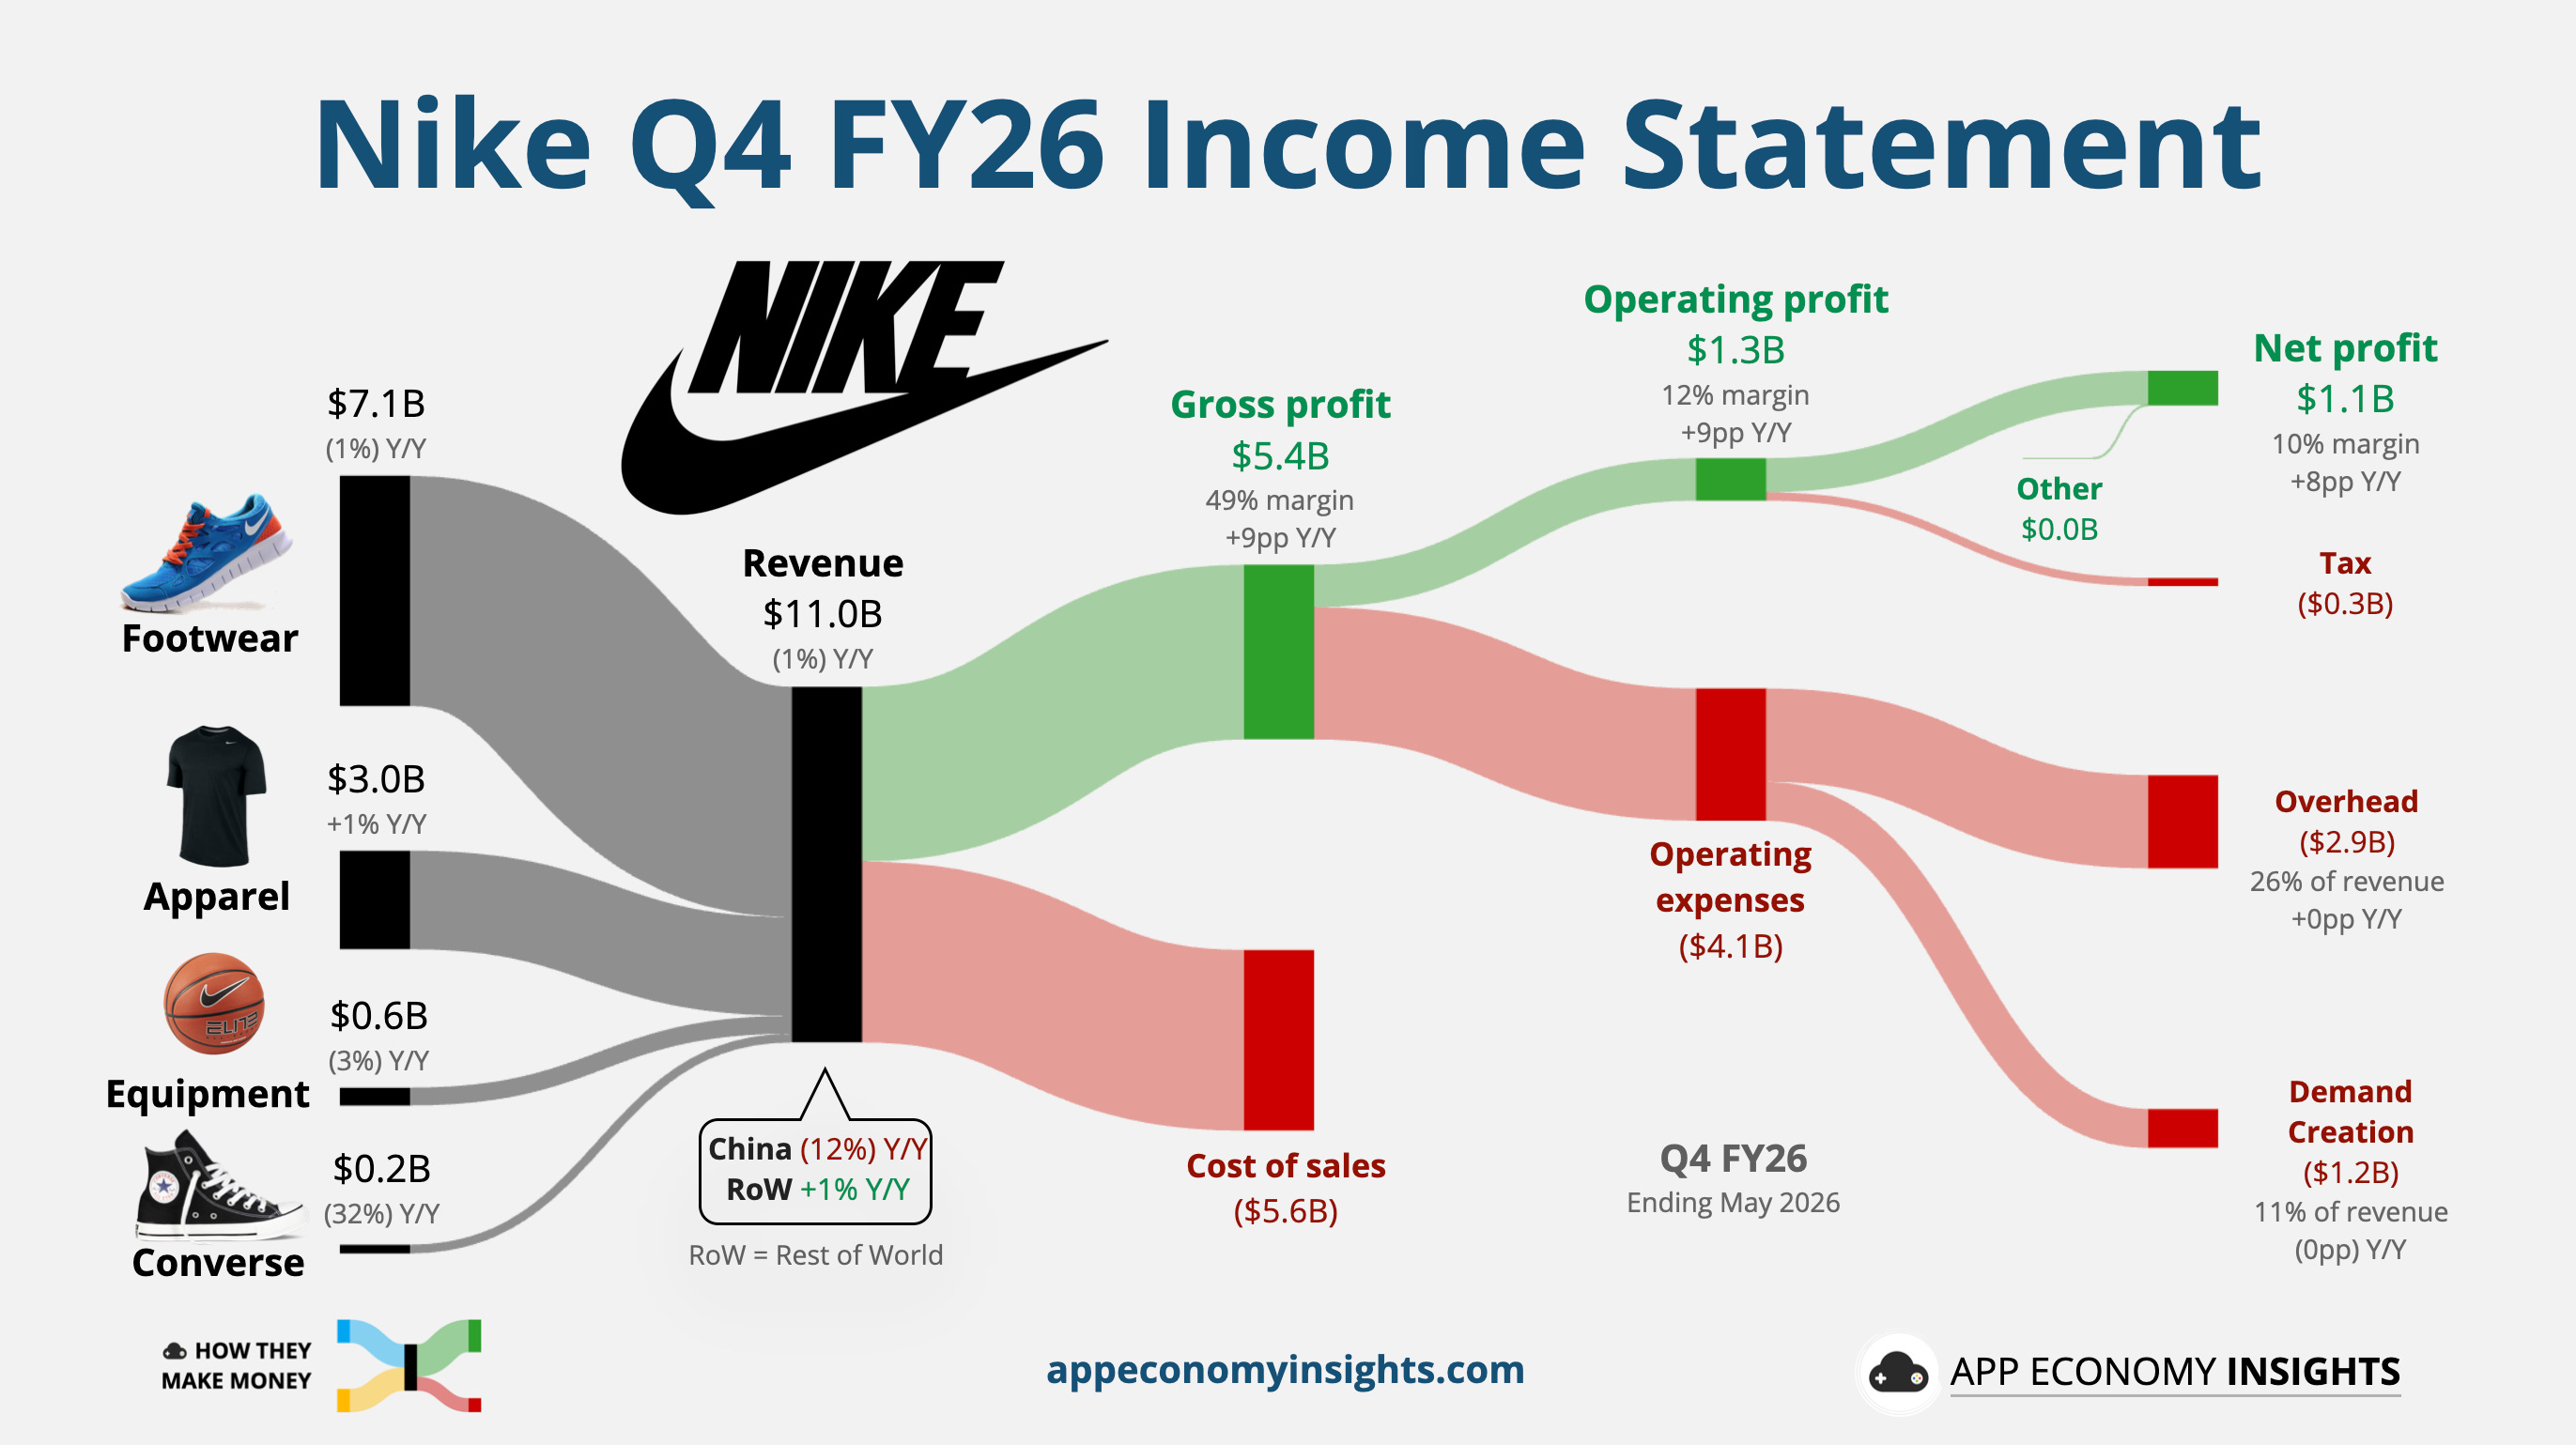
Reported gross margin hit 49% (+9pp Y/Y), one of the highest in Nike's history, but ~9pp of that was the tariff refund. Underlying gross margin was ~40%, essentially flat and still near the lows of the reset.

Wholesale rose 4% to $6.6 billion.
NIKE Direct fell 7% to $4.1 billion, with Nike Brand Digital down 12%.
The trade kept margins compressed and shrank Nike's own channels, but it did help push North America back to growth.
North America grew 3% to $4.8 billion, with wholesale up 10% as Nike rebuilt the retail relationships it spent years walking away from. Nike Running notched its fifth straight quarter of double-digit growth, adding roughly $1 billion to the category and five points of market share across North America and Western Europe. That was the clearest proof that Hill’s “Sport Offense” (the reorg that moved 8,000 employees into sport-specific teams) could create growth. The progress was real but uneven. A Boston Marathon ad got pulled after backlash, and some World Cup stock missed its retail delivery window.
International was still the drag:
Greater China: Sales fell 12% Y/Y to $1.3 billion (down 17% in constant currency), with segment profit down 20%. Results beat lowered expectations, but local brands like Anta and Li-Ning continued to take share. The "comprehensive reset" Hill is running is expected to weigh on results through FY27.
EMEA: Revenue slipped 1% Y/Y to $3.0 billion, but down 6% in constant currency, so the underlying business is losing even more momentum.
APLA: Roughly flat at $1.6 billion, up 1% Y/Y reported and down 1% in constant currency.

Revenue plunged 32% Y/Y to just $244 million, and full-year sales were the lowest since 2011. Neil Saunders of GlobalData suggested that if Nike couldn't or wouldn't fix the brand, it should weigh an exit before Converse became a drain on management's attention. Hard to argue.
Nike expected Q1 FY27 revenue to be down low-to-mid single digits and earnings roughly flat through Q2 FY27 (excluding the tariff benefit), though gross margin should finally start expanding as early as Q1.
Outgoing CFO Matt Friend was blunt: "We are not expecting the environment to improve meaningfully over the next six months." He warned that Nike's customers were under pressure worldwide. Friend will hand the reins to David Denton, Pfizer's CFO, on August 17. A fresh set of eyes, arriving at an awkward moment.
Bottom Line: Nike's profit surge was a one-time tariff windfall. The stock has fallen more than 30% this year, on track for a fifth straight annual decline. That said, North America and Running are the first hard evidence that the reset can produce real growth after months of inventory cleanup. At ~28x forward earnings, this is still a "show me" story, and the real test comes at November's investor day.
That's it for today.
Happy investing!
Thanks to Fiscal.ai for being our official data partner. Create your own charts and pull key metrics from 50,000+ companies directly on Fiscal.ai. Save 15% with this link.
Disclosure: I own AAPL, GOOG, META, NVDA, and TSLA in App Economy Portfolio. I share my ratings (BUY, SELL, or HOLD) with App Economy Portfolio members.
Author's Note (Bertrand here 👋🏼): The views and opinions expressed in this newsletter are solely my own and should not be considered financial advice or any other organization's views.
2026-07-01 20:03:03
Welcome to the Premium edition of How They Make Money.
Over 300,000 subscribers turn to us for business and investment insights.
🔥 The June report is here!
All the key earnings visuals from the past month in one report.
✔️ Cut through the noise with clear, concise financial snapshots.
✔️ See revenue trends, profit margins, and key takeaways instantly.
We visualized 200+ companies this season:
In case you missed it:
Download the full report below or log in to your account.
Your voice matters! Help us shape future reports. Got a company or sector you're curious about? Hit 'Reply' and let us know!
Here’s a sneak peek. 👀'
![Screen Recording 2026-06-30 at 5.30.23 PM.mov [video-to-gif output image]](https://substackcdn.com/image/fetch/%24s_!-njh!,f_auto,q_auto:good,fl_progressive:steep/https%3A%2F%2Fsubstack-post-media.s3.amazonaws.com%2Fpublic%2Fimages%2Fcc4adac7-d137-4355-bf95-18c09073d6d3_800x448.gif "Screen Recording 2026-06-30 at 5.30.23 PM.mov [video-to-gif output image]")
What to expect in this monthly report?
⚙️ Semis: Broadcom, Micron.
🛒 Retail: Home Depot, Lowe’s.
😎 Tourism: Carnival, Vail Resorts.
🤖 AI infrastructure: Oracle, Cerebras.
👟 Consumer brands: Nike, Lululemon.
☁️ Workflow: Adobe, DocuSign, GitLab, UiPath.
📊 Data: C3.ai, HPE, MongoDB, Rubrik, Samsara.
🛡️ Cybersecurity: CrowdStrike, Palo Alto Networks, SentinelOne.
And more, like Accenture, Darden, Didi, Meituan, FedEx, Fox, and GameStop.