2026-08-03 16:00:07

Emacs is one of the big classic text editors, right up there next to vi. It’s famous for its interface and its ubiquity across the *nix world. It’s such a core piece of software in the coding world that it has showed up a fair few times in popular culture—and [Ian Y.E. Pan] has collated some of those appearances.
 Emacs played a role in The Social Network, the retelling of the origin story of Facebook (the social network everybody used to use). Notably, Mark Zuckerberg used the tool to slap together a script for scraping a website. It also appears in Tron: Legacy, Arctic Blast, and the tech TV comedy Silicon Valley—more than once, in fact.
Other appearances include comics, Japanese anime series Key The Metal Idol, and a few miniseries and documentaries to boot.
[Ian]’s list is unlikely to be exhaustive. Both because he hasn’t seen every movie or TV show ever made, and because you can make new content featuring Emacs references tomorrow if you so desire. Still, it’s fun to see some of the famous properties that have featured good ol’ Emacs.
Don’t hesitate to let us know if you happen to put together a similar list about vi. The tipsline is waiting.
2026-08-03 13:00:57

As easy as it is to make a late 1980s-style game console using a modern microcontroller, there’s arguably more fun in doing things the traditional way. This is the challenge that [Throaty Mumbo] took upon himself when he embarked on his retro game console project, called simply the Game Console V2.

In the accompanying video the development process and other details are covered and demonstrated. Most notable perhaps are the proper cartridges with ROMs on a parallel bus rather than something like SD cards, and the absence of any modern ports including even VGA. This means only composite AV output like in the good old days of RF splitters and other assorted fun.
The NTSC output signal is generated by an RP2350 MCU in the form of the PGA-shaped PGA2350 breakout board that’s wired into a 6-bit R-2R network for RGB332 output via the RCA jack, while audio is fed into a PCM5102A I2S DAC. For controllers you get 4-pin Bulgin SA2367 connectors and an N64-compatible protocol.
It’s noted that the use of an RP2350B MCU is temporary, as the goal with the V3 version of the project is to take it into a proper 8- or 16-bit CPU direction. We’re certainly looking forward to seeing this next revision of what looks to be a pretty interesting game console.
2026-08-03 10:00:18

The Theremin is that classic electronic musical instrument that makes those weeee-ohhhhh noises which were so popular in mid-century science fiction movies. Mid-last-century, that is, because this century is just beginning. In any case, you could build one with old-school analog electronics, or you could go a more modern route, as [ericCycles] did.
The build relies almost entirely on an ESP32 microcontroller with minimal supporting circuitry. Like any other Theremin, pitch and volume are controlled by moving hands closer or farther away from two antenna. In this case, the ESP32 uses its capacitive touch circuitry to detect effectively detect hand proximity to the two antenna in question, and uses those values to control the pitch and volume of a synthesized waveform. That waveform is then pumped out over the onboard digital-to-analog converter for playback on external speakers.
If you want to build a simple Theremin-like instrument quickly and easily, it’s hard to beat the simplicity on offer here. We’ve featured some other fun variants over the years, too, like this version that uses time-of-flight sensors for the human interface.
2026-08-03 07:00:22

About a month ago, we brought you word that the commercial rescue mission designed by Katalyst Space to save NASA’s Swift gamma-ray observatory had reached orbit and early indicators were looking good. Unfortunately, it didn’t take long for things to start going sideways, and up until very recently, the situation seemed pretty dire. But according to an interview with Katalyst’s CEO published yesterday by Ars Technica, the company has made some impressive progress on getting things back under control.
For reasons unknown, the robotic vehicle started tumbling out of control last week. Shortly after that, mission controllers lost contact with Swift. After 24 hours without contact from the ground, the spacecraft automatically performed a sort of “hard reset” in an attempt to regain communications. That got it talking again, but somewhere along the way the craft overheated, which in turn cooked the control circuitry for the reaction wheels, which would usually be used to control its orientation. Not great, not terrible.
As of yesterday’s update, we now know that engineers have figured out a way to gimbal the thrust from the craft’s xenon-fueled electric thrusters — which were originally intended for orbit-raising — to counteract its spinning. It’s slow going as these thrusters don’t have a lot of kick, but it seems to be working. We’ll keep an eye on this one and let you know when we know more.
Katalyst isn’t the only company producing a robotic savior with an uncertain future. If you enjoy starting the day with some freshly prepared eggs, but never quite mastered the skills required to make them, the Efficient Gastronomic Operational Robot (EGOR) may be for you. The $400 countertop gadget, which can be had for 50% off during the Kickstarter campaign, can not only crack the eggs for you, but can cook them to whatever style you wish. It even has the ability to start the process at a specific time, say a few minutes before your alarm goes off in the morning.

There’s a certain Jetson’s-like appeal to EGOR, but it’s hard to imagine there’s a huge market for a $400 “robot” that’s only function is to cook eggs. At the same time, we don’t think comparisons with the disastrous Juicero Press are entirely accurate. What doomed the Juicero, beyond the $700 price tag, was the fact that it was only capable of squeezing juice out of proprietary pouches that needed to be purchased separately. If you could have put whole fresh fruit into the machine and it could have automatically rendered it into juice, as you can put eggs from the grocer into EGOR, it probably would have stayed on the market for a bit longer.
All that being said, the end result is still going to be the same for folks like us. Eventually somebody is going to take apart an EGOR, and we’ll get to see what makes the breakfast bot tick. Then we just have to wait until these things start hitting the curb to see what the community can do with their guts. Maybe it will be as fun as our teardown of the Quirky Egg Minder.
On the subject of impending gadgetry, 9to5Google has released leaked images of what appears to be Google’s long-awaited answer to Apple’s AirTag. While the search giant has offered their “Find Hub” service for a while now, there hasn’t actually been an official first-party device to utilize it. All we know about Google’s offering is that it’s visually differentiated from Apple’s device thanks to its more oval shape, and goes by the highly imaginative name of “Google Pixel Tag.” More official information is likely to start appearing in the coming weeks, coinciding with the launch of the Pixel 11. We’ll have to wait a bit longer to find out when the company will decide to unceremoniously abandon them all, however.
Finally, we leave you with a recently uploaded video from the USS Cod Submarine Memorial that explores an area of the WWII Gato-class submarine that we had no idea existed, but which makes perfect sense in retrospect. Given the enormous number of vacuum tubes required by the submarine’s 1940s vintage radio equipment, and the vital wartime necessity to minimize the downtime of said systems, the submarine has a dedicated storage compartment specifically for tubes and other spare parts directly under the radio room. The radio operator could simply open a hatch at his feet, descend a small ladder, and have immediate access to shelves full of the parts he would need to keep his station up and running.
Of course, modern naval vessels will have stores of critical spare parts as well. But the unique storage and organization requirements of vacuum tubes, combined with the near certainty that some number of them would need to be replaced while the submarine was on patrol, meant they needed to be kept close at hand at all times.
See something interesting that you think would be a good fit for our weekly Links column? Drop us a line; we’d love to hear about it.
2026-08-03 04:00:29
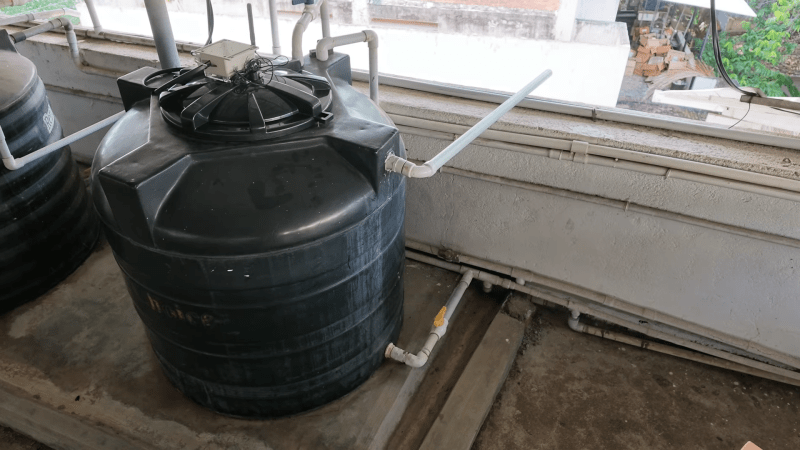
[Jumpor] lives in a part of India where the water infrastructure is a little frustrating to use. Water gets delivered to underground tanks outside of homes, and must then be regularly pumped into rooftop tanks prior to use inside the building. Typically, this pumping is handled manually—by switching on a pump and running it until water comes out of an overflow pipe to indicate the rooftop tank is full. [Jumpor] decided to improve this wasteful and time consuming process with a little automation project.
The build is based around an ESP32 microcontroller. It’s hooked up to an ultrasonic sensor which can measure the water level inside the rooftop water tank. When the sensor detects the level descending below a set point, the microcontroller fires a relay to trigger the lift pump to fill up the tank. Once the sensor detects the tank is full, the pump is shut off, saving liters of water compared to waiting for water to pour out of the overflow as an indicator of the same.
It’s a simple enough project, but [Jumpor] was sure to include the important practical considerations. Since the rig was being installed in a rental, it was desirable to not make any permanent modifications to the water system. Thus, a fresh cap for the water tank was modified to host the electronics and level sensor, such that the original could be replaced at a later date. Due consideration was also paid to things like avoiding crossing the minimum detection threshold of the sensor, which could lead to accidental overflows if not managed correctly.
The aim of this project was to ease the day to day burden of maintaining a basic utility. That’s the sort of project we love to see around these parts.
2026-08-03 01:00:23
One of the best parts about DIY chemistry and physics projects is that you get to decide how early in the supply chain you want to begin, such as with [Hyperspace Pirate]’s adventures in ethanol production from sugar fermentation. Although you can certainly just buy packs of sugar and yeast from the store and pretend that this will be helpful once the world embraces its Mad Max era, you may as well start with the stuff that actually grows on trees, like fruit.
While you could use the ethanol produced this way as ethanol fuel in combustion engines and the like, you can also turn the ethanol into ethylene and ethane. That way you can fill up your refrigerator, freezer, and air conditioner to keep your perishable foods and yourself fresh as the outside world descends into highly questionable fashion choices.
Even outside such a scenario it makes sense to generate your own ethane and ethylene, due to how much these refrigerants cost. Once you have the ethanol, some aluminium oxide catalyst at 350°C is enough to produce ethylene and water. Producing ethane is admittedly a bit more involved, requiring acetobacter bacteria to produce acetic acid, along with baking soda, a platinum anode and a few more odds and ends.
Producing butene and even longer chains from ethylene is also possible as a next step, but this gets even hairier than producing ethane from ethanol, so we’re likely to see this in a future update after all the low-hanging fruit has been harvested.