2026-08-02 11:19:05
“It is a lot to cope with the rollercoaster of the last decade and deep uncertainty of what’s coming next. Over many years, the quality and depth of the newsletter has ensured I am better informed and inspired.” — Hugh K., a paying member
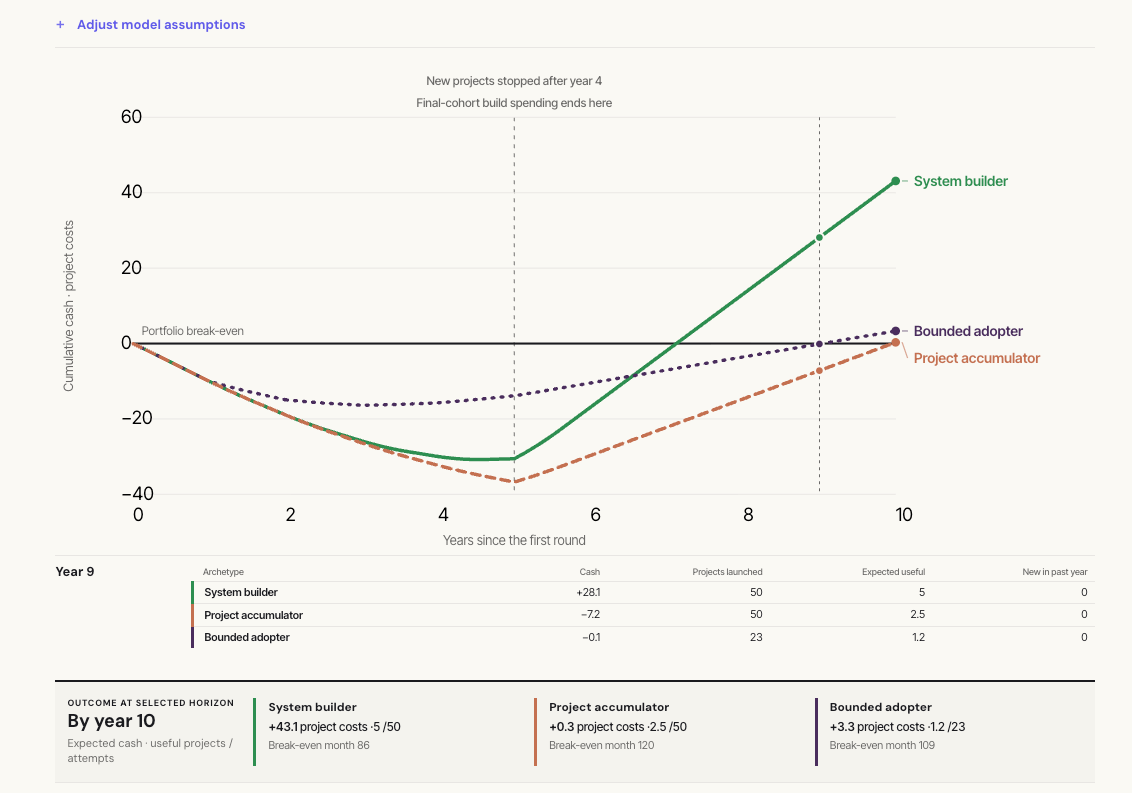
We modeled three types of companies adopting AI. They have the same starting economics, the same 5% hit rate, but different learning practices. Two years into their investment, all three are losing similar amounts of money. In year five, the eventual loser looks best. It takes eight years to see which approach leads to outsized ROI.
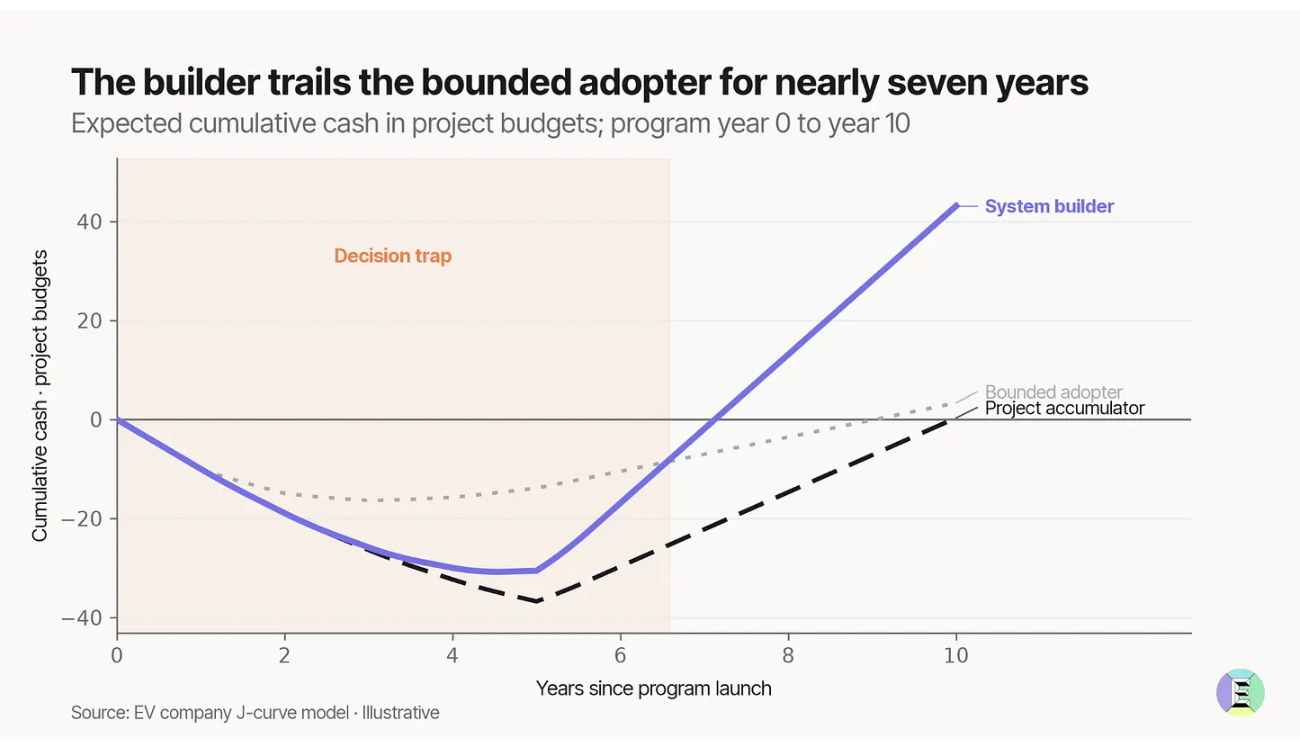
Most CEOs are facing the decision trap right now – you likely don’t know if your firm’s spending is learning that will compound to ROI, or waste. The FT calls Zuck “the king of the side quest” as he works away on a portfolio of bets:
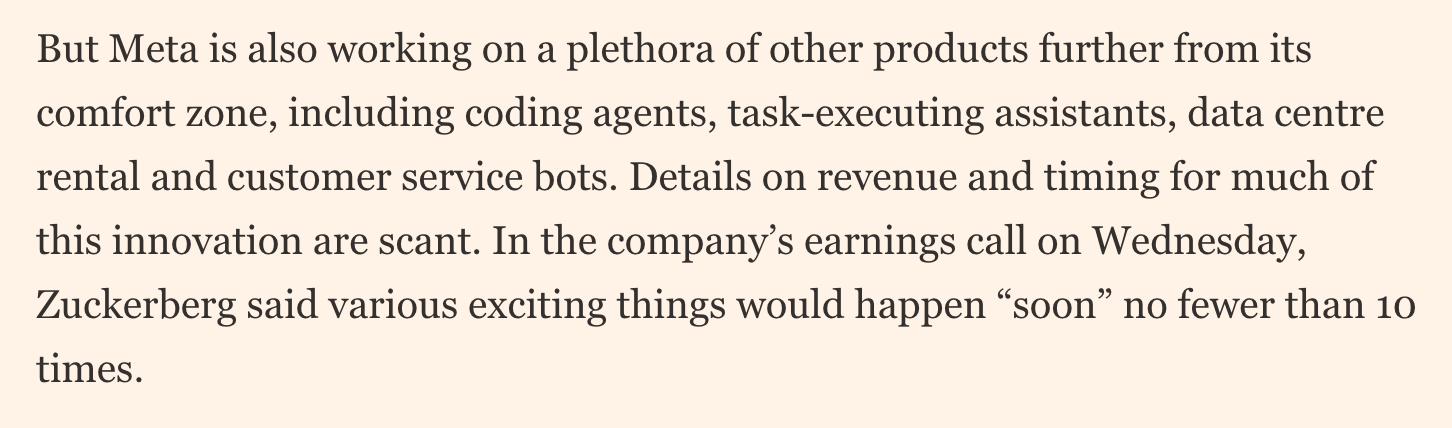
Mark doesn’t need each project to succeed, as long as the experiments deepen Meta’s infrastructure and inform the next move. In our model, system builders that consistently compound their learnings over time have the winning formula. See our framework and the interactive model:
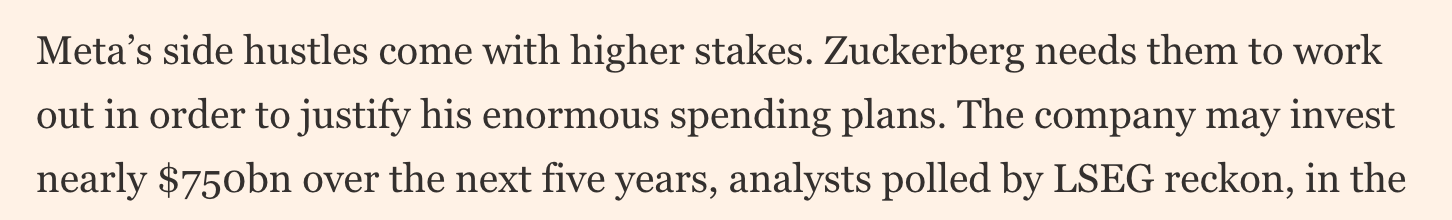
A $45 billion fund at its peak, started by an AI researcher with no hedge fund experience, betting on the AGI capex build-out at roughly four times leverage, was forced to liquidate this week. Leopold Aschenbrenner started Situational Awareness LP in late 2024 on a thesis that the path to superintelligence would put trillions into compute, chips and power.
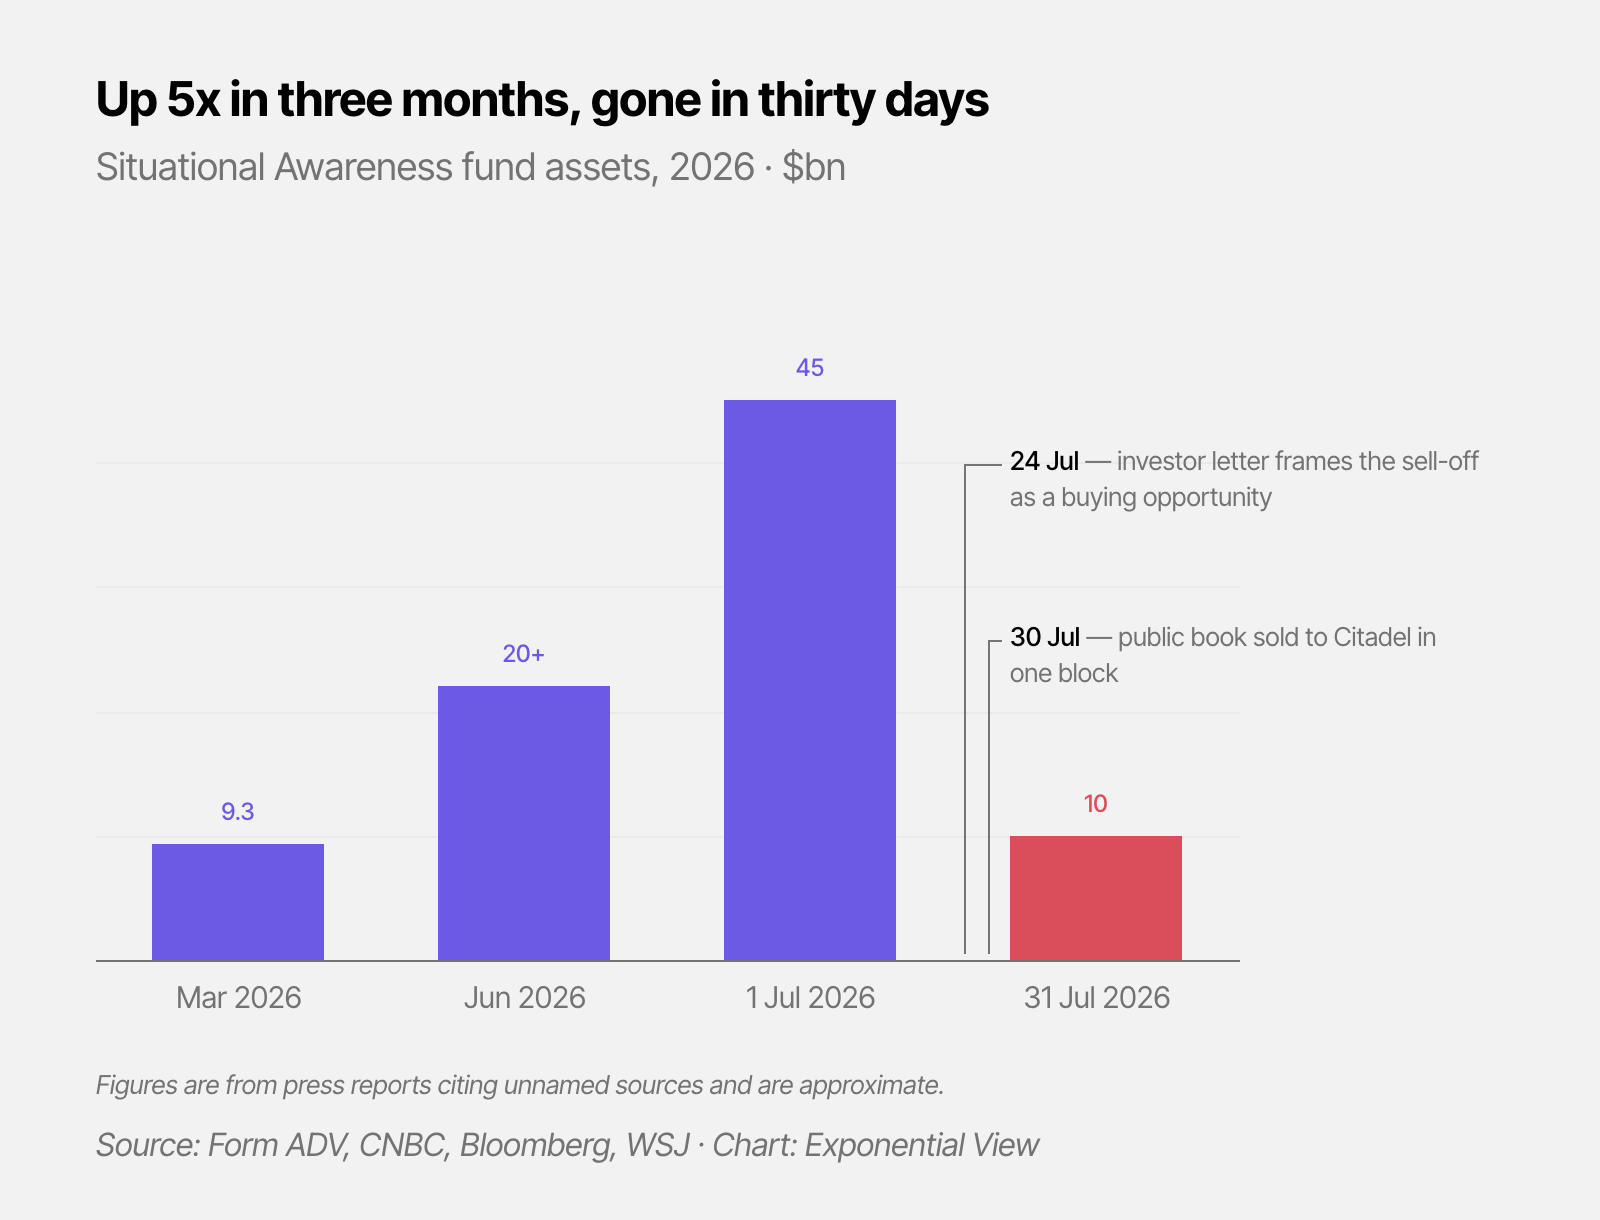
He did great. And then, the trade turned. The Philadelphia Semiconductor Index fell 28.6% from its June peak, and software gained.
Situational Awareness’ unraveling is not proof that Leopold’s thesis is wrong.
2026-08-01 14:07:26
Readers often ask me what books are on the bookshelf you see behind me in my videos.

One of the surprising effects of working with AI is that I spend much more time reading long-form, books and journal articles in particular. More than before, I appreciate a book as a complete thing, an idea held together by an author, chewed over, possibly for years, and presented in a new way.
There are over 350 titles on the bookshelf in my study. The oldest one is a 231-year-old first edition. The newest is likely an advance reader copy of something I have been sent. As I’ve been working on my new book this year, I’ve really been focused on reading things relevant to that, and I haven’t read as broadly as I normally would.
I do want to share some suggestions of things you might want to read over the final month of summer while trying to be a little bit non-obvious, focusing on older titles or the left field.
As a side note, I’m wildly impressed by how well-read Exponential View readers are from what you share in the community Slack (join if you’re a member on the annual plan) and when we meet in person.
Here you go:

Vincenzo Latronico’s Perfection looks at the meticulously curated life of a pair of digital nomads currently holed up in Berlin. The reality isn’t the Instagram feed. Perfection is my top choice.
I don’t read much poetry. But I turned to Richard Siken’s latest collection in an attempt to learn. He wrote I Do Know Some Things after suffering a stroke that wrecked his language skills. It takes you through his journey of relearning who he is. It is prose as poetry, flat and unrelenting.
I’ve also really fallen back into Russian literature for the first time in decades.
Dostoevsky’s Notes from Underground is just a standing rebuke to anyone who thinks humans make great decisions. It’s the protagonist standing tall against every version of utopia.

Scientific nihilism clashes with romantic liberalism in Turgenev’s novel. This is a tale of generational disruption and of what even disruptors can’t remove. I dropped my copy in the swimming pool.
2026-07-30 19:01:20
The world is waiting for AI to deliver returns to the economy. The New York Times published this headline a year ago.
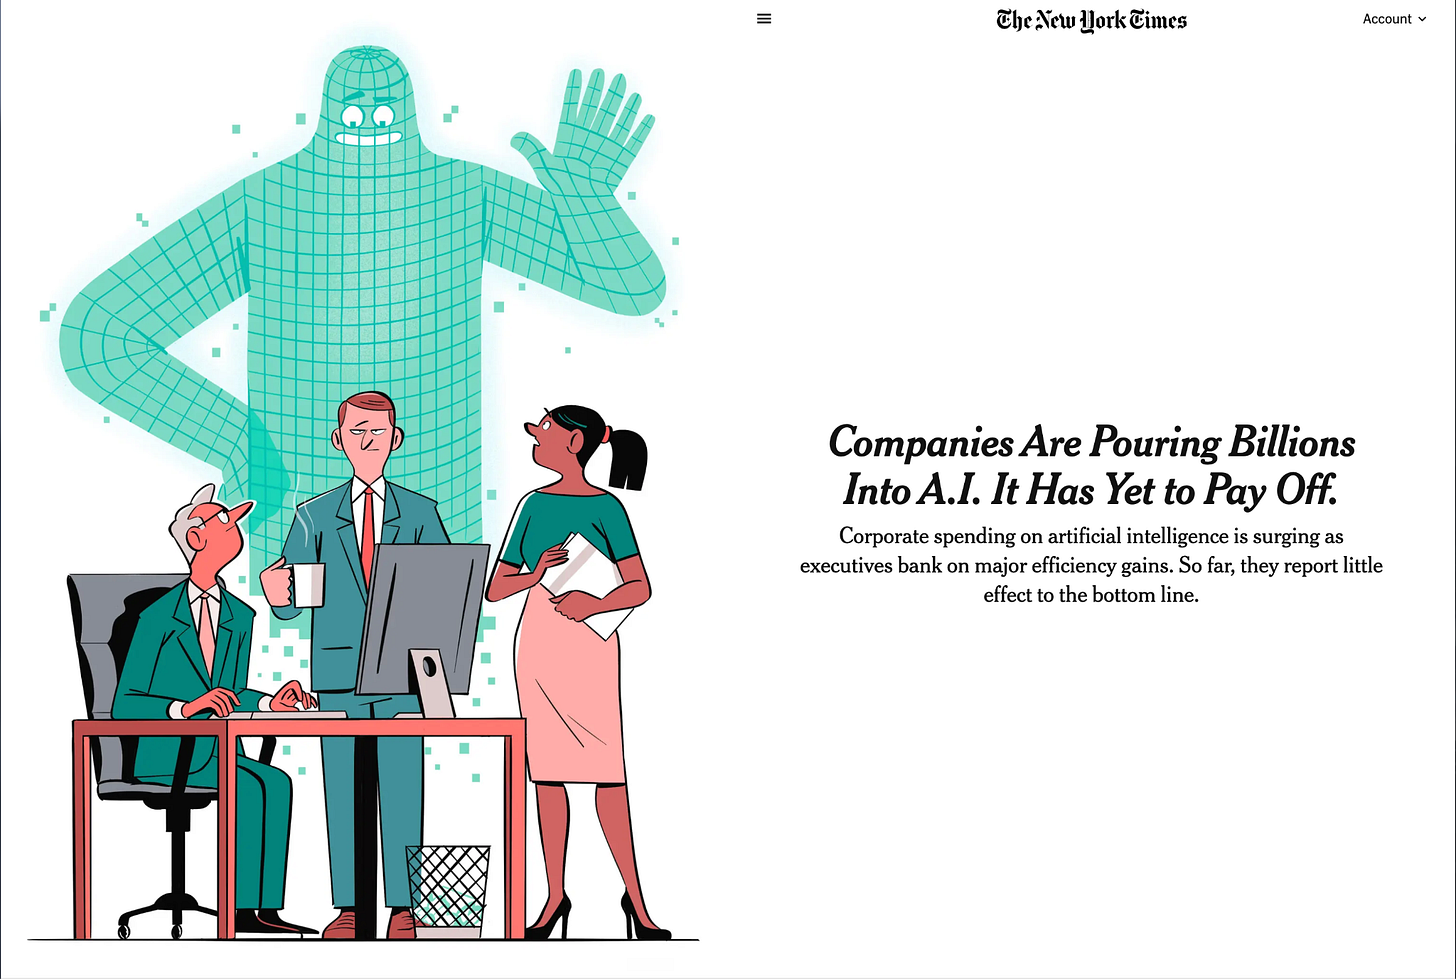
Reuters ended 2025 with “Companies still waiting.” Seven months into 2026, the waiting continues. Barclays says that broad adoption of AI has not yet lifted productivity.
Executives are under pressure to show they can deliver – half of all CEOs BCG surveyed worldwide say their jobs depend on getting their AI strategy right. Public disclosures of net AI returns are patchy. JPMorgan’s estimate of $1-1.5 billion in value from its AI use is a rare case of a company naming a number.
Adopters are spending a lot, so where are the returns? That is the question most are asking right now. And yet, in a successful technology rollout, the first visible economic signal may not be the returns. Winners and losers might look the same. We have created a model to show why this is the case and what signals to follow to understand if your AI adoption is going well.
Members of Exponential View get access to the full interactive model to test the assumptions behind today’s essay.
All investments follow a path. You might begin by buying an office building, starting in the red. You earn a return by leasing it to tenants, which can bring you into neutral and, if all goes well, you’ll climb to profitability.
Investing in new technology can follow a similar path. Much of the upfront cost is learning how to use the technology – new processes, skills training, making changes to the organization. Mistakes are almost guaranteed, and learning is expensive. The learning bill will almost certainly arrive before your returns.
Learning is a continuous practice, not a one-time exercise. It happens through a series of projects, each with its own investment J-curve. A company might have dozens of projects at different stages of maturity running at once.
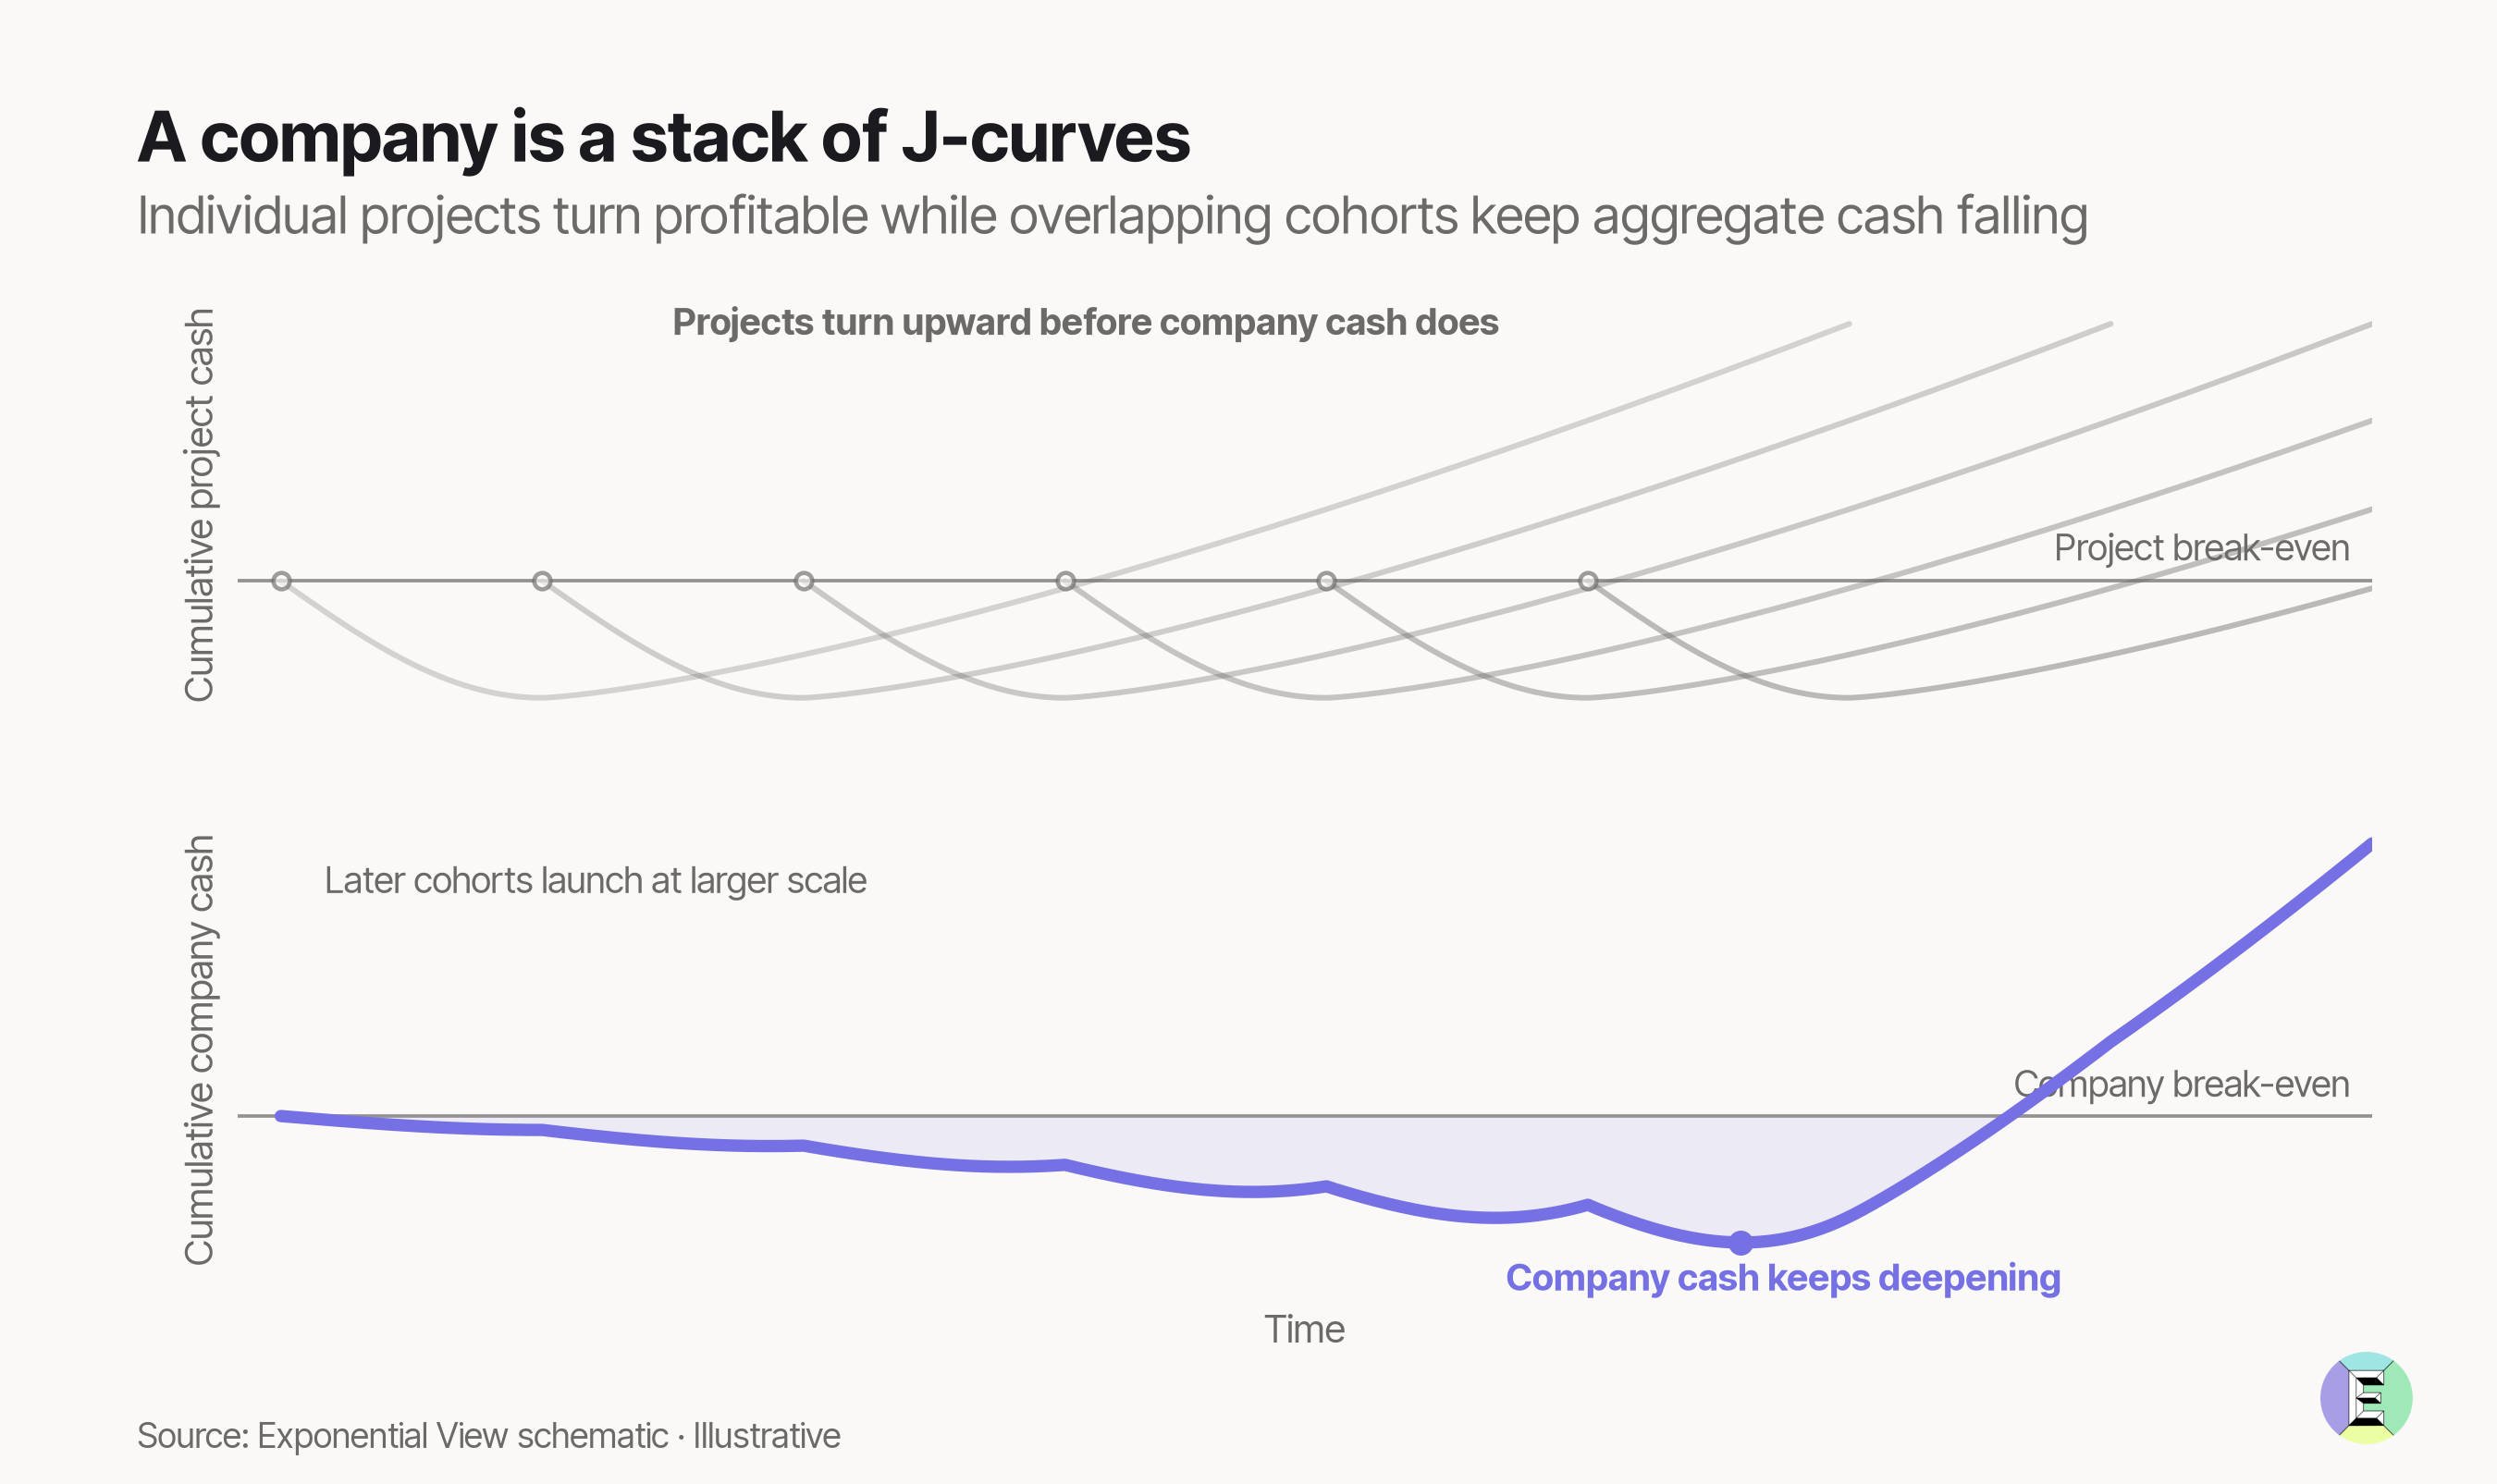
If we adopt the premise that the AI economy is going through a J-curve – firms are investing upfront, learning through deployment, and scaling what works – at the aggregate level, this can make a successful rollout look expensive, even irrational, before it looks productive.1
Our model has three archetypes of companies experimenting with a general-purpose technology, in this case AI:
Bounded adopters find something that works, put it to work, and then stop experimenting.
In 1976, the NYSE’s Designated Order Turnaround system allowed member firms to send small orders to the floor electronically, bypassing the human broker who would normally carry them. Even as the system caught on – by 1999, more than 90% of orders arrived this way – it automated only the delivery of orders; human traders still executed the trade. In 2000, NYSE’s market structure committee rejected a fully electronic order book and chose to keep the floor and its specialists.
But competitors didn’t wait. By 2005, Nasdaq, which already had automated execution, was handling about 15% of trading in NYSE-listed stocks. Eventually, NYSE switched. It merged with the all-electronic Archipelago in 2006 (a combination then valued at $9 billion), and in 2008 the SEC approved a plan that phased out specialists.

Borders, an American book retailer, is another example of bounded adoption. In 2001, it entered into an agreement with Amazon to run its e-commerce site. At this time, Borders was one of the top operators of bookstores in the world, and the Amazon deal helped it maintain an e-commerce site. But that’s where Borders stopped developing its in-house online capability, and its growth remained anchored in physical stores. Only in 2008 did Borders bring its own e-commerce site back in-house, ending the Amazon agreements after nearly seven years. By then it was too late and Borders filed for bankruptcy in 2011.
The project accumulator keeps exploring, but rarely or never learns. It launches new projects without figuring out what separates the winners from the losers. Nothing carries forward, so each project starts with the same odds as the last.
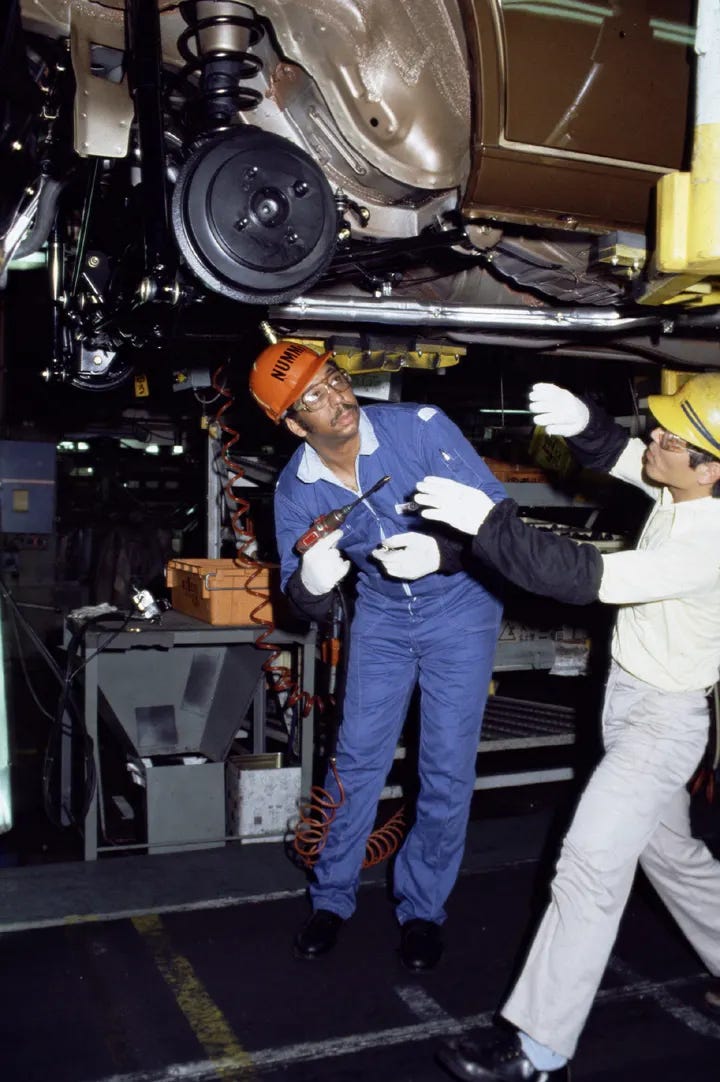
In the 1980s, GM made multiple automation bets at once. It bet on factory robots, modernized plants, a $2.5 billion acquisition of a data-processing firm; it created Saturn, a new car brand subsidiary with a new factory and labor arrangements; and it bet on NUMMI, a joint venture with Toyota. By 1986, GM’s capital spending was going to hit $10 billion.
Of all the projects, NUMMI seemed the least likely to succeed. Toyota got GM’s worst-performing factory and rehired the same workforce that was let go when the factory closed down in the past. Under new management, NUMMI outperformed every other GM factory. GM saw this happen, knew what was working well, but for various reasons, the learning traveled too slowly to be transformative.
2026-07-27 22:15:47

Hi,
Here’s our Monday roundup of data signals across AI, energy and markets.
Enjoy!
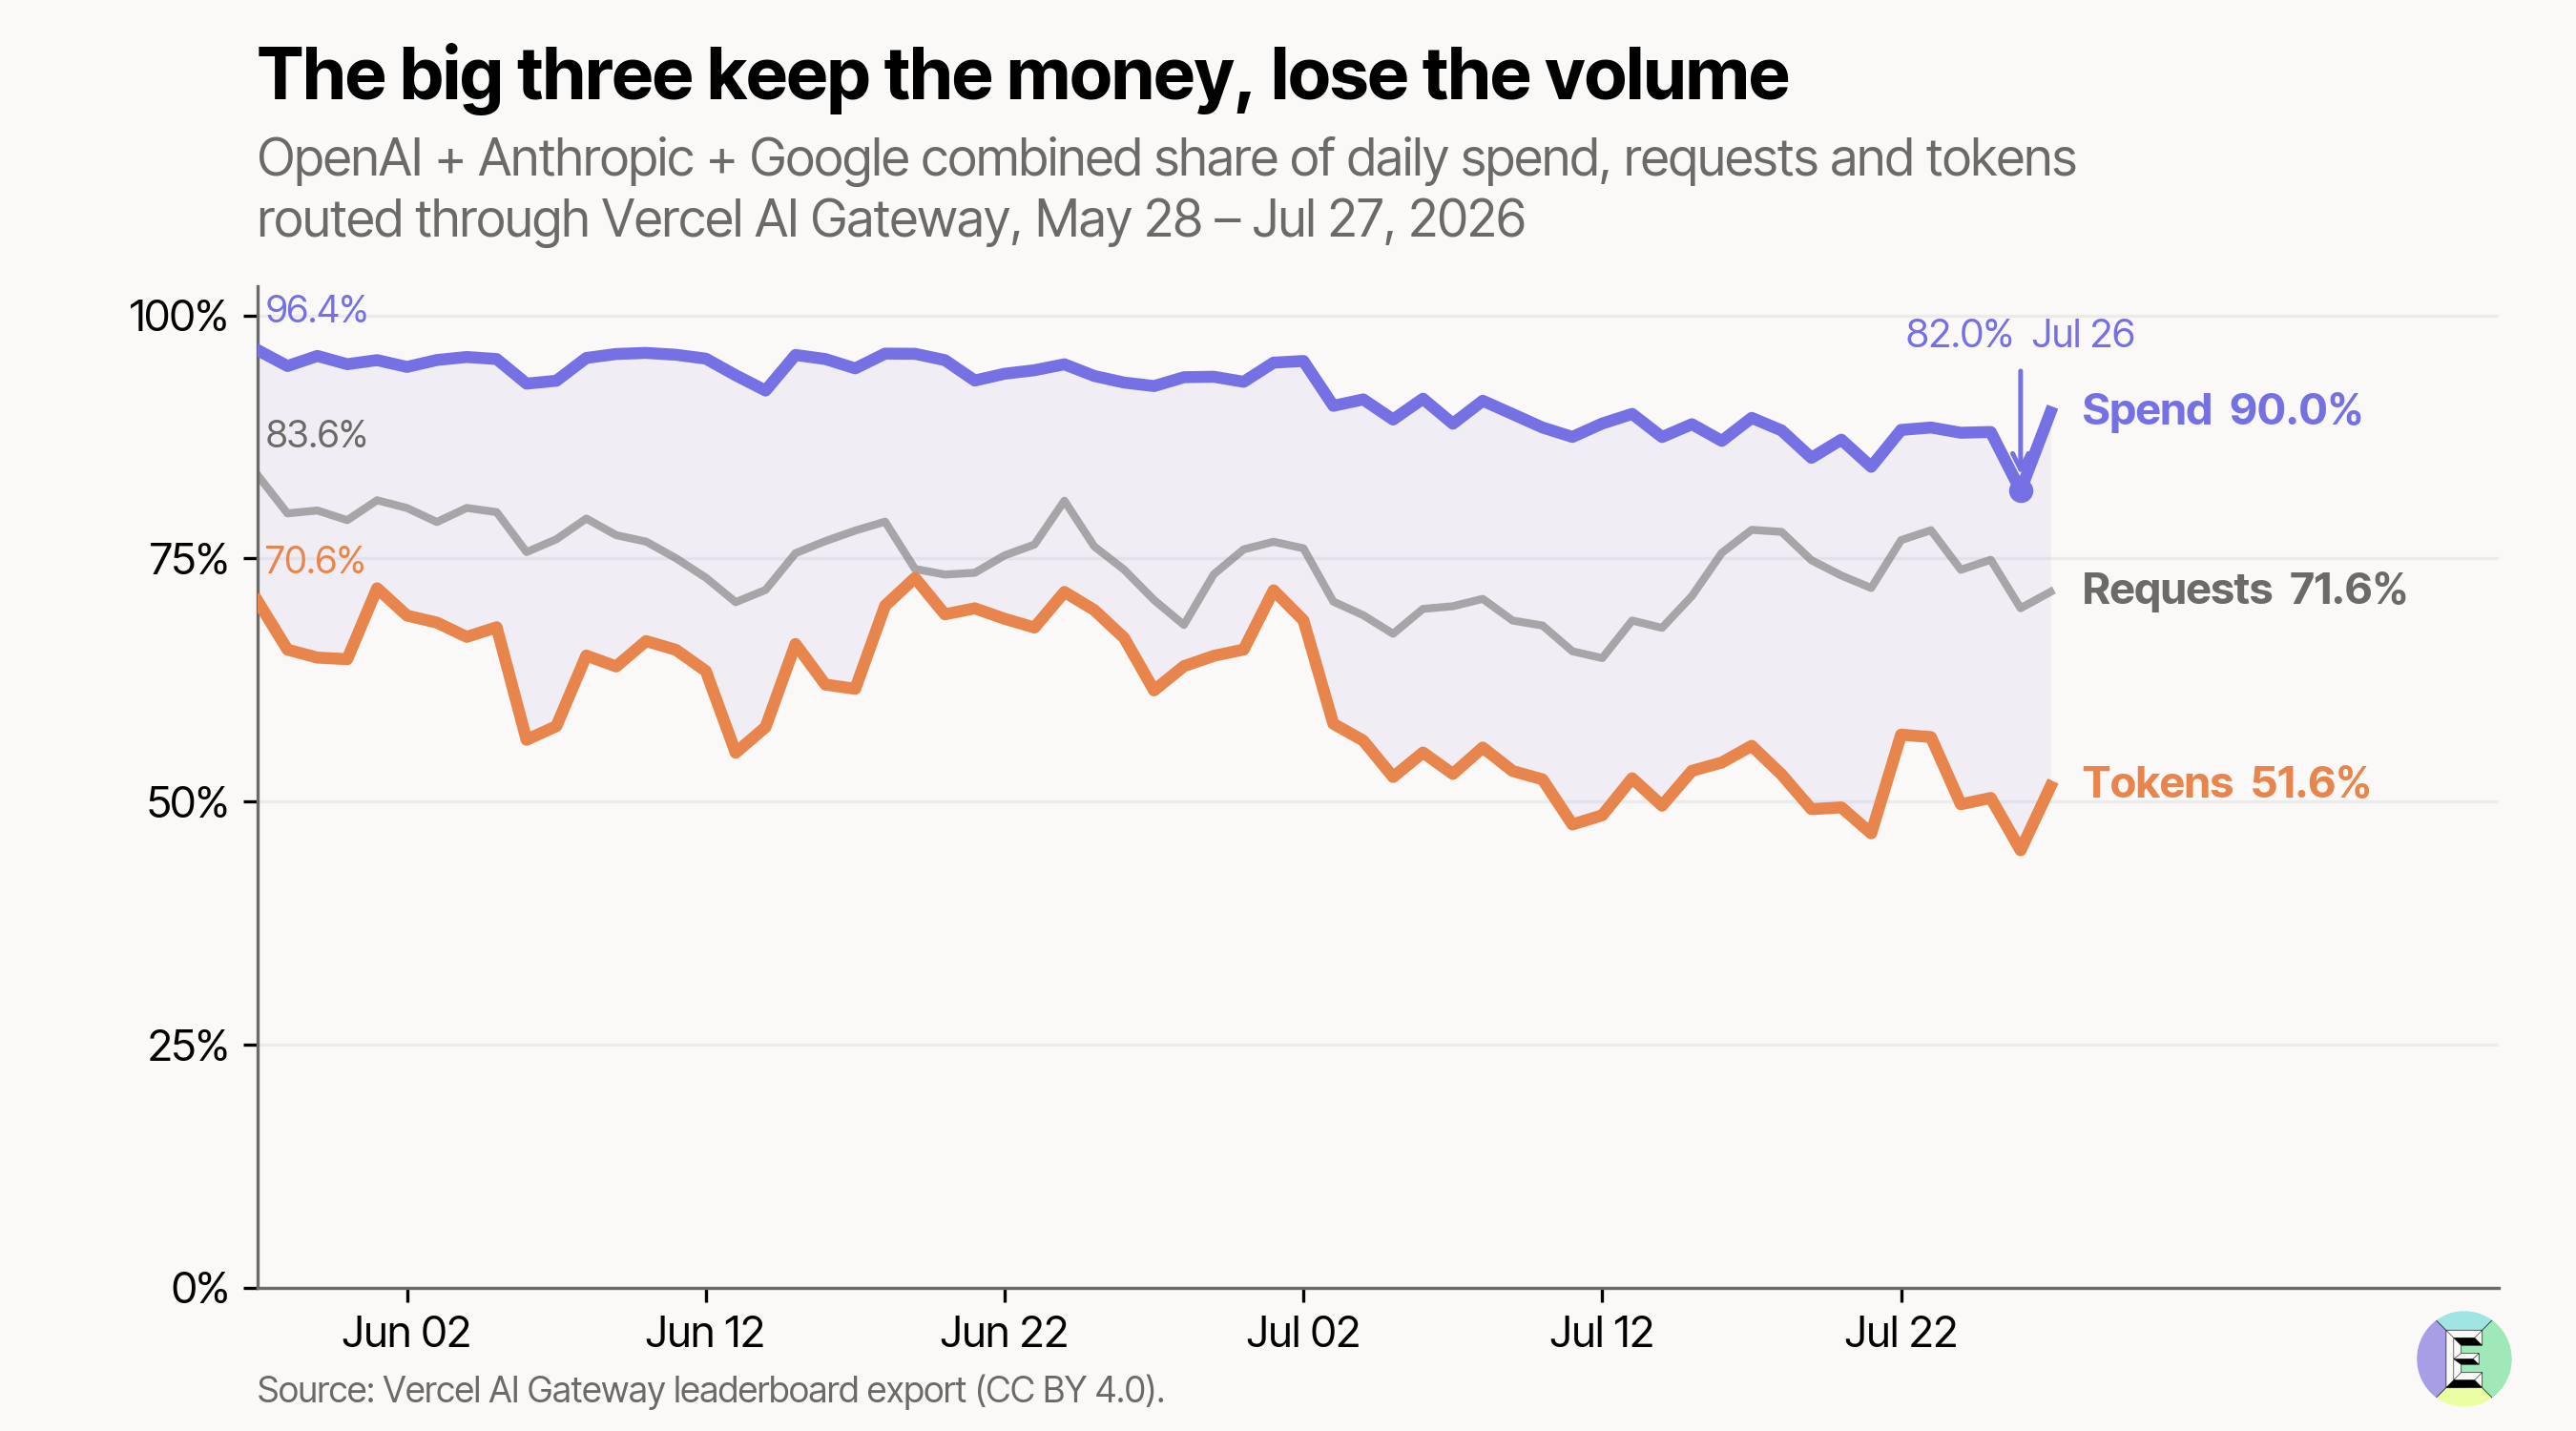
Rents for the incumbents. OpenAI, Anthropic and Google take 90% of spend on Vercel’s AI Gateway, but only make up 52% of the tokens. For the average token, the Big 3 generate more than 8x as much revenue as the rest of the field1.
Selective use. AI reaches 68% of occupations in the US; within professions, it covers ⅕ of a typical job’s tasks.
Cheap fables. Users seem to find output from Cursor’s Router on Auto Intelligence mode just as good as Fable at ~60% lower cost.
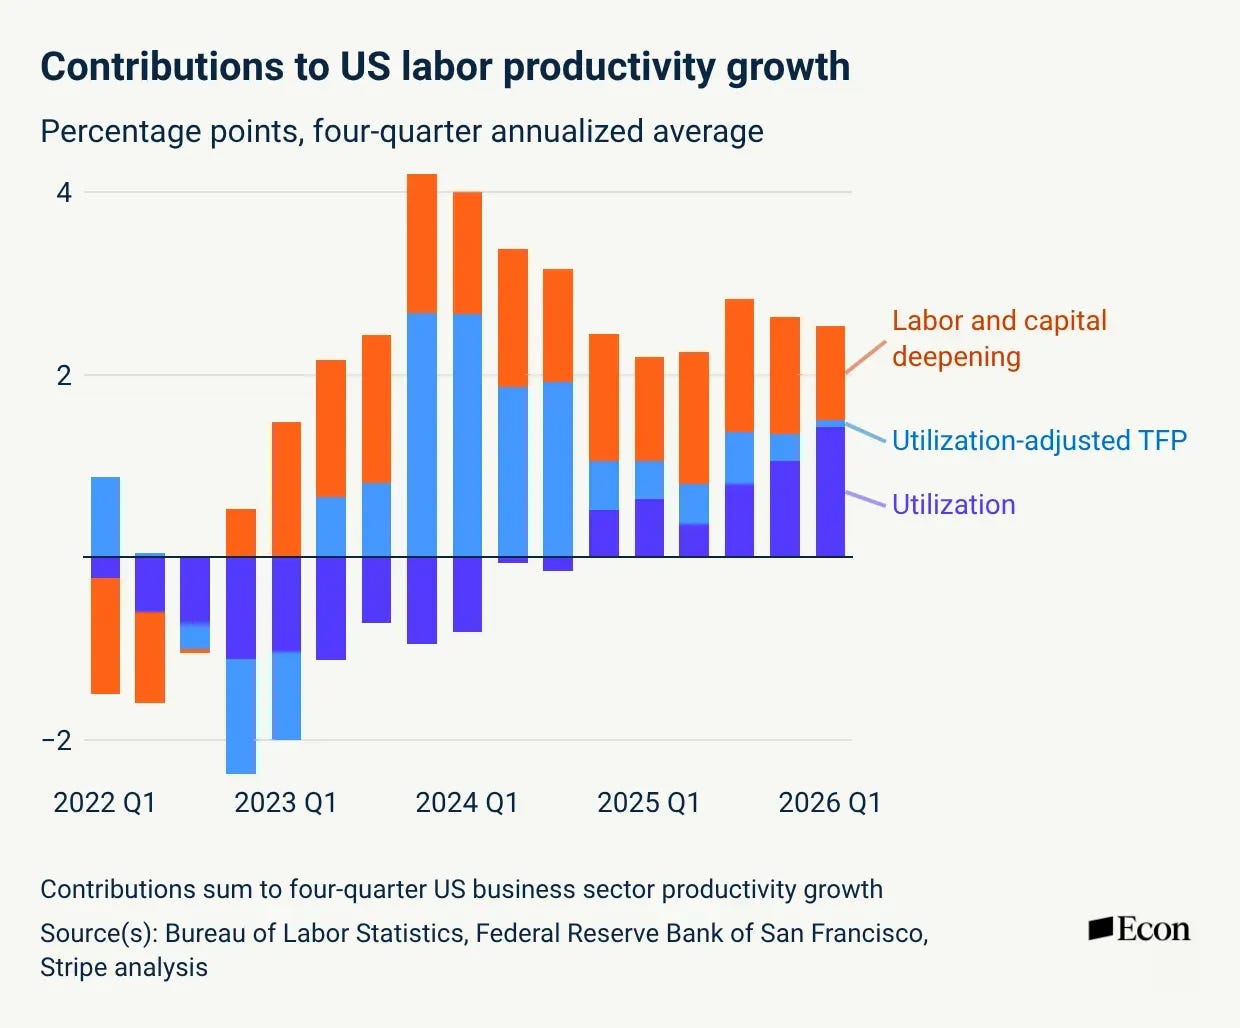
Utilization, not transformation. US labor productivity is up, largely because firms are running the existing capital harder, with little change in total factor productivity (TFP)2.
Drugs good for the economy. GLP-1s cut long-term sickness leave by 17% over four years in Denmark. It didn’t move employment or pay; the benefits accrued to employers and public finances.
Governance and oversight are the biggest concerns among teams adopting agentic AI – for a good reason. Your agents can read sensitive information, take actions for you and work for a long time without oversight.

The companies least at risk will be those with governance frameworks that help them scale AI with confidence.
Okta’s 5-minute assessment will give you a score of how secure your AI agents are today and show exactly where the risks are.
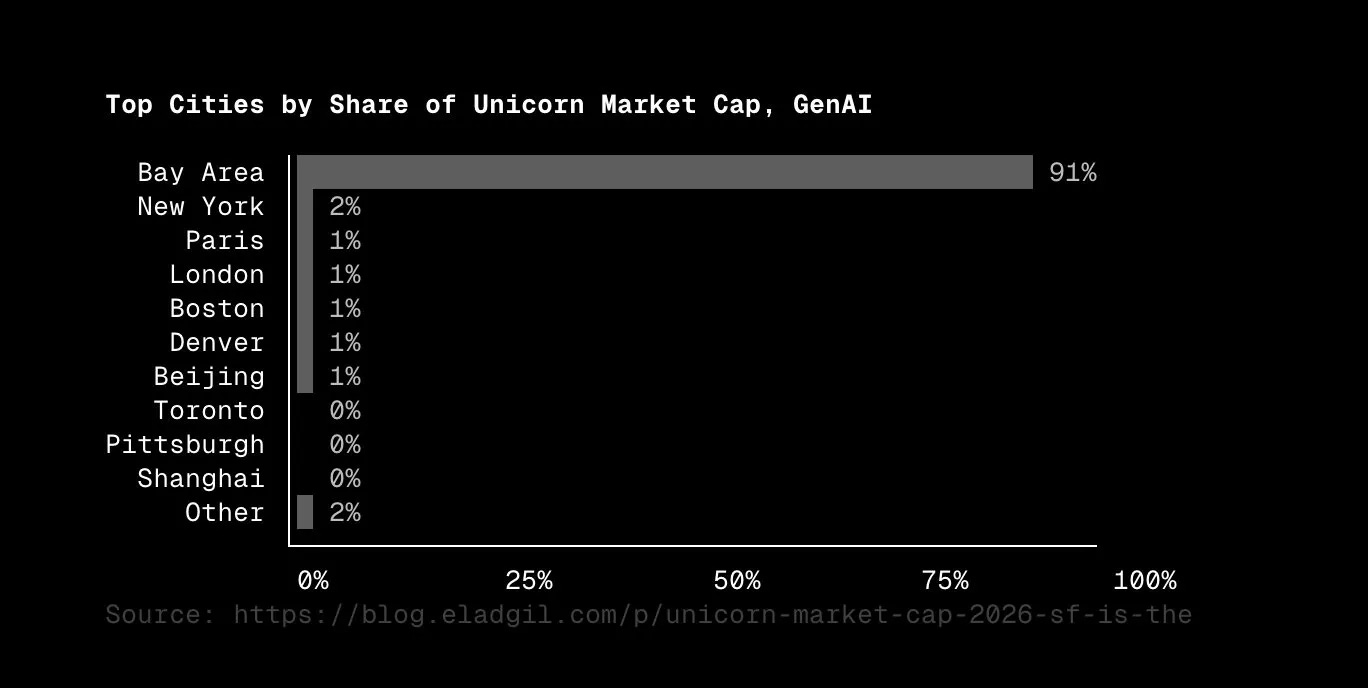
Unicorn central. The Bay Area accounts for 91% of the generative AI unicorn market cap and 39% of the market cap, including all unicorns.
In the hands of the few. In the US, 5% of VCs generate 90% of investment profits.
Cities without kids. The number of kids under 5 in large US cities has dropped 15% in the last decade, even in cities where the population is growing.
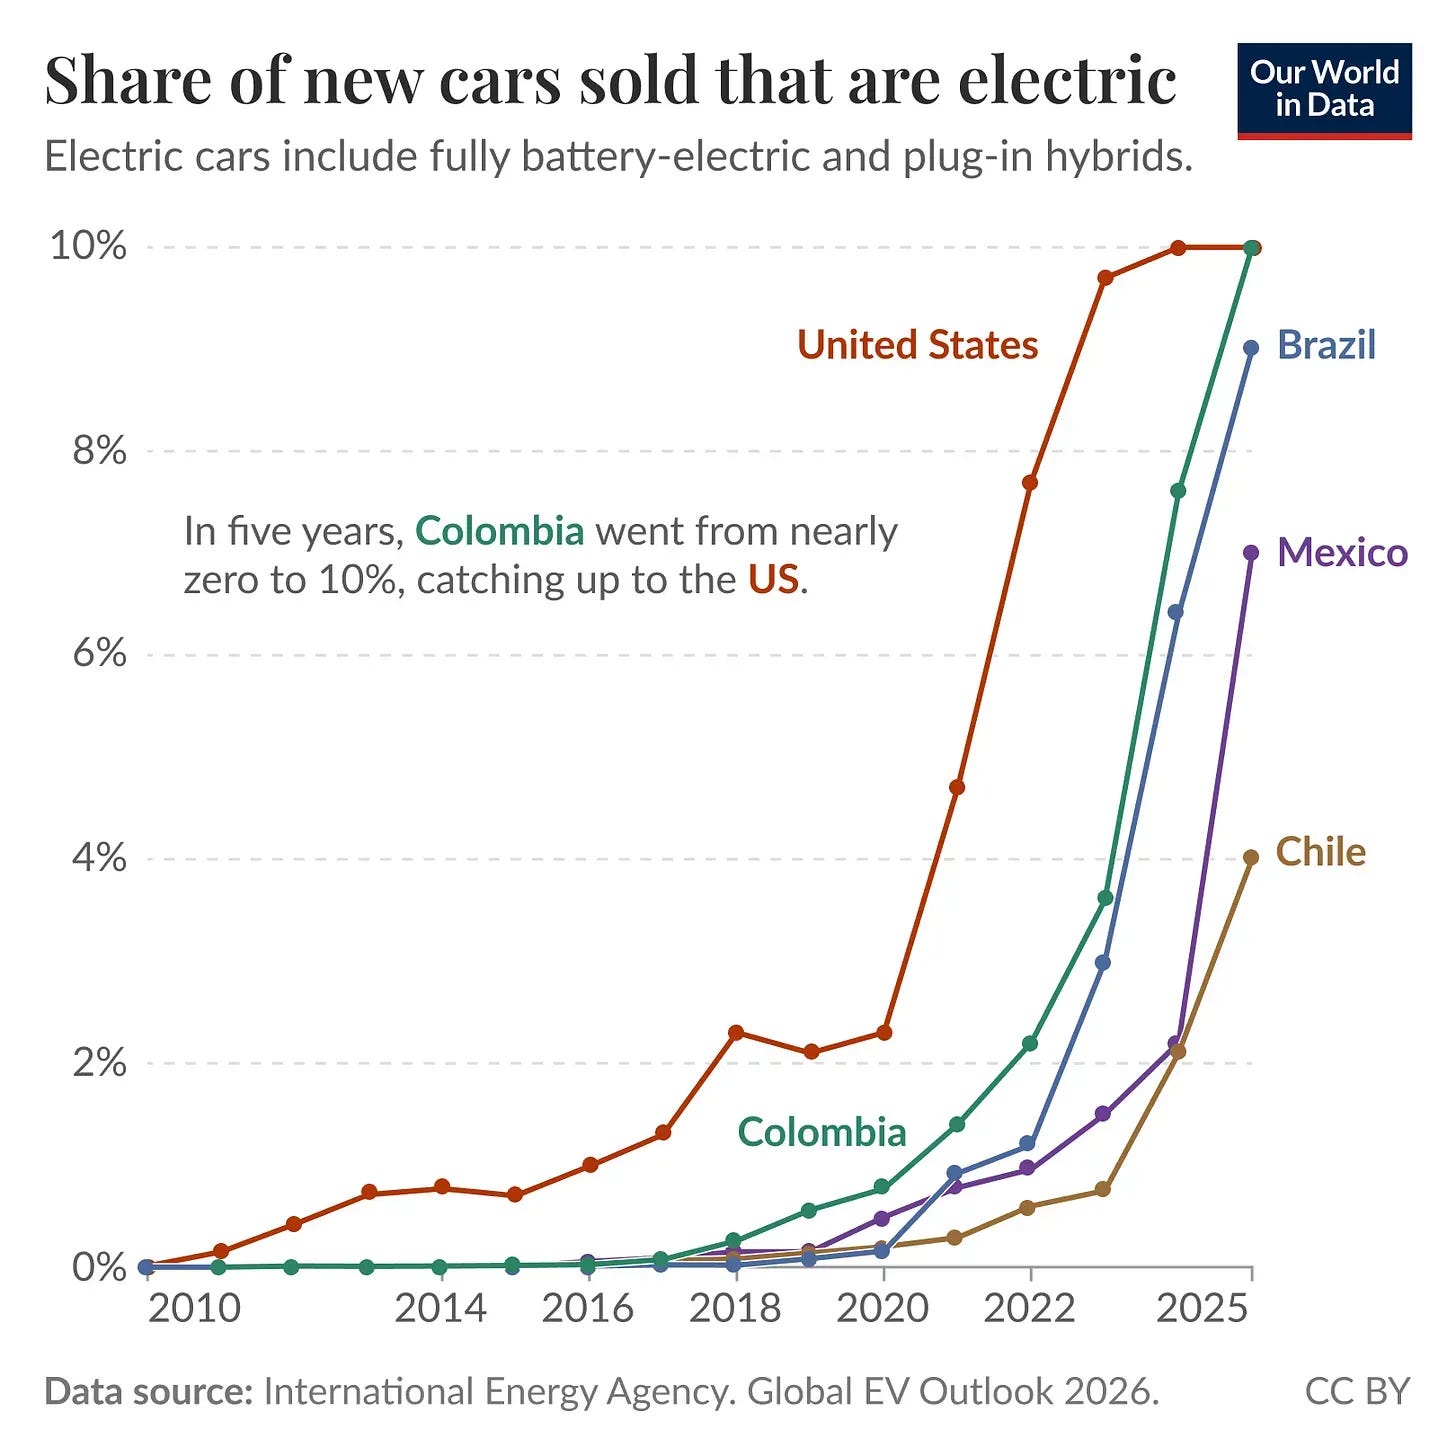
Policy impact. Despite a late start, electric vehicle sales in Latin America are catching up to the US thanks to tax breaks and other incentives.
Thanks for reading!
Calculated using Vercel’s AI Gateway leaderboard.
Total Factor Productivity refers to output gains that cannot be explained by increases in resources such as labor and capital. For example, this could be in the form of new knowledge, efficiencies, better organization, or other improvements.
2026-07-26 10:43:29
Hi,
Welcome to the latest Sunday briefing! I am off on holiday for a couple of weeks. The team will continue to tend to Exponential View while I’m gone, so you won’t miss a beat.
Azeem
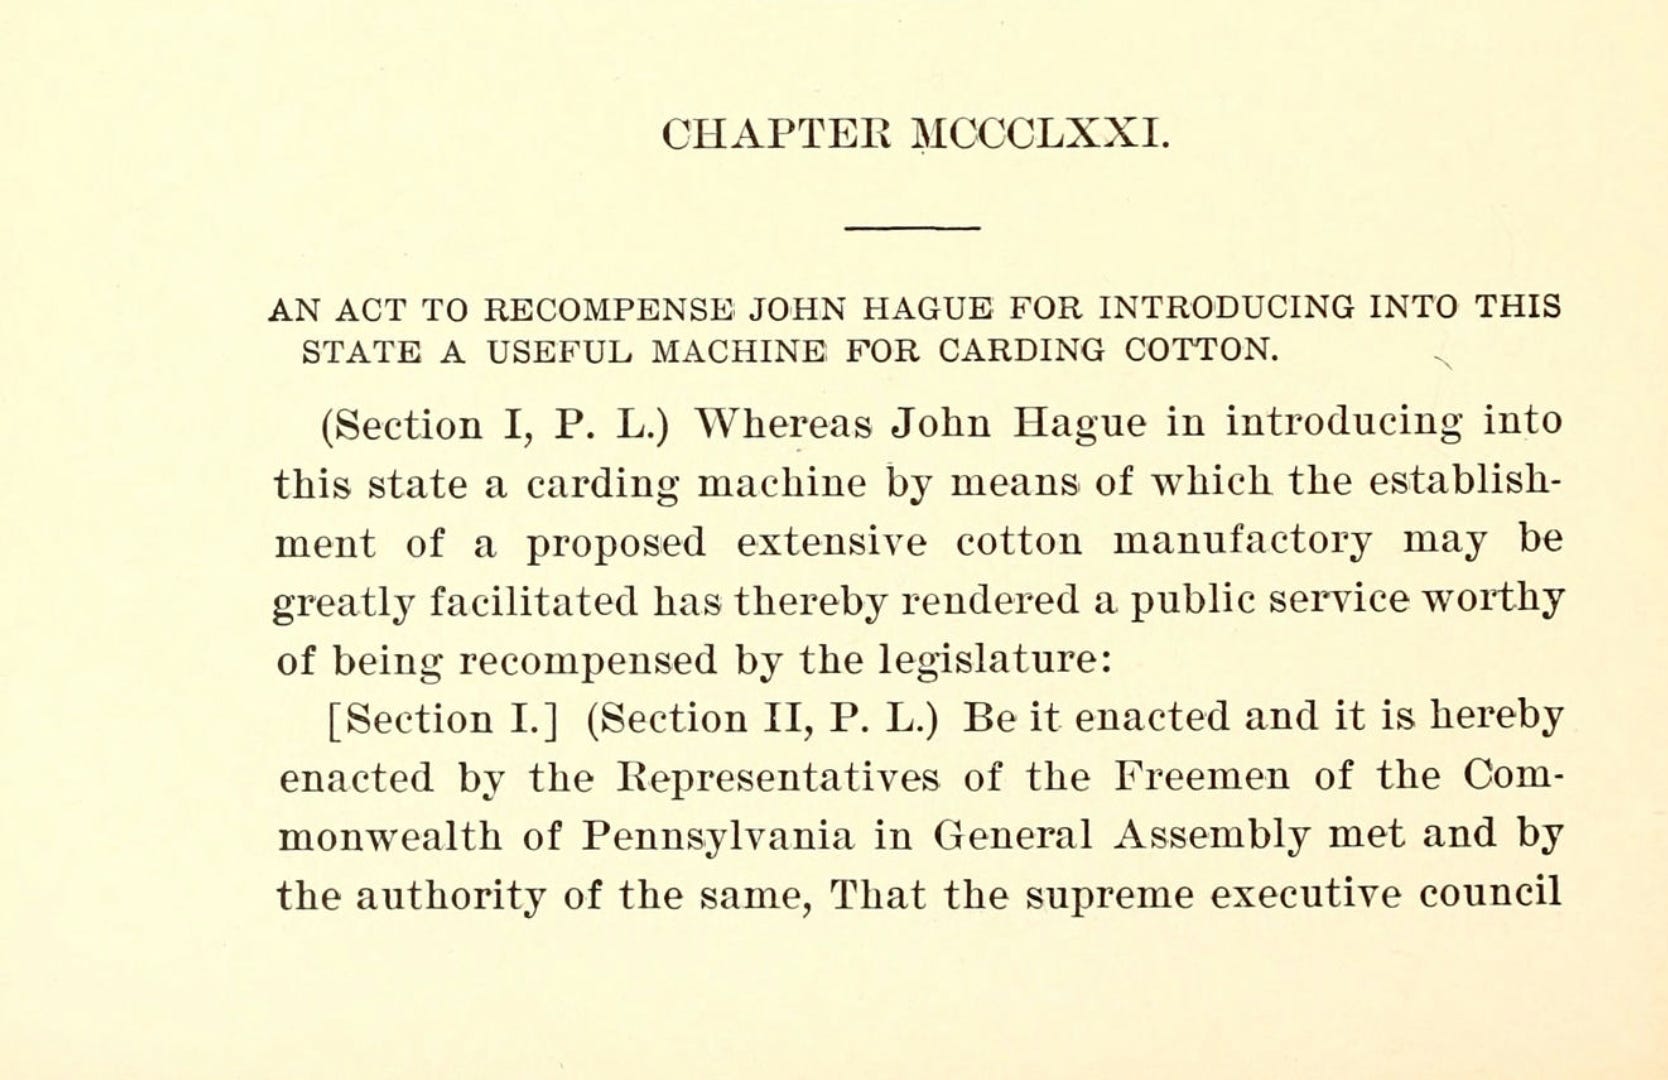
On 1st September 1789, Samuel Slater set sail from England for New York. He’d learned that the Pennsylvania legislature had recently passed an act awarding £100 to a British textile worker who smuggled high-end machinery into the state. America was going to great lengths to acquire industrial know-how, by any means possible.
Britain had made it illegal to export textile machinery and technical drawings. The ban extended to prevent textile workers from emigrating. Slater had worked in mechanized textile mills and saw his chance.
He committed the entirety of Richard Arkwright’s system – the first factory method for spinning cotton – to memory. He disguised himself as a farm laborer and broke the laws of his nation as he carried himself across the Atlantic, valuable know-how secretly distilled into his brain.
By 1790, Slater was a partner in a cotton mill in Pawtucket, Rhode Island, built from the plans he memorized. President Jackson called him the “Father of American Manufactures.” He died in 1835 worth around a billion dollars in today’s terms.1
Today’s question is to what extent are Chinese AI labs distilling the outputs of American AI models – and is it really a problem? The easy answer is the hawkish one: hugely and yes, it is. But it’s not the only answer.
First of all, distillation is a decades-old machine learning technique in which a larger model can train a smaller, more efficient model. A lab running distillation internally is not an issue. But it is possible to distill a model from the outside (even without the provider’s permission). This is the accusation against Kimi and other Chinese labs.
Almeida, a four-year veteran of OpenAI, explains that effective distillation is much harder today than a few years ago, when AI models helpfully provided their reasoning traces. What Almeida calls “behavior parroting” is to learn from final answers, the least powerful approach but might still work well to help bootstrap another model.
There is substantial evidence that both Chinese and American researchers have trained models on the outputs of frontier systems. Stanford’s Alpaca project has admitted as much. Anthropic has alleged that DeepSeek, Moonshot and MiniMax have used more than 16 million Claude chats via 24,000 fake accounts. Michael Kratsios, Trump’s science chief, says he now has evidence of how Moonshot ran distillation attacks.
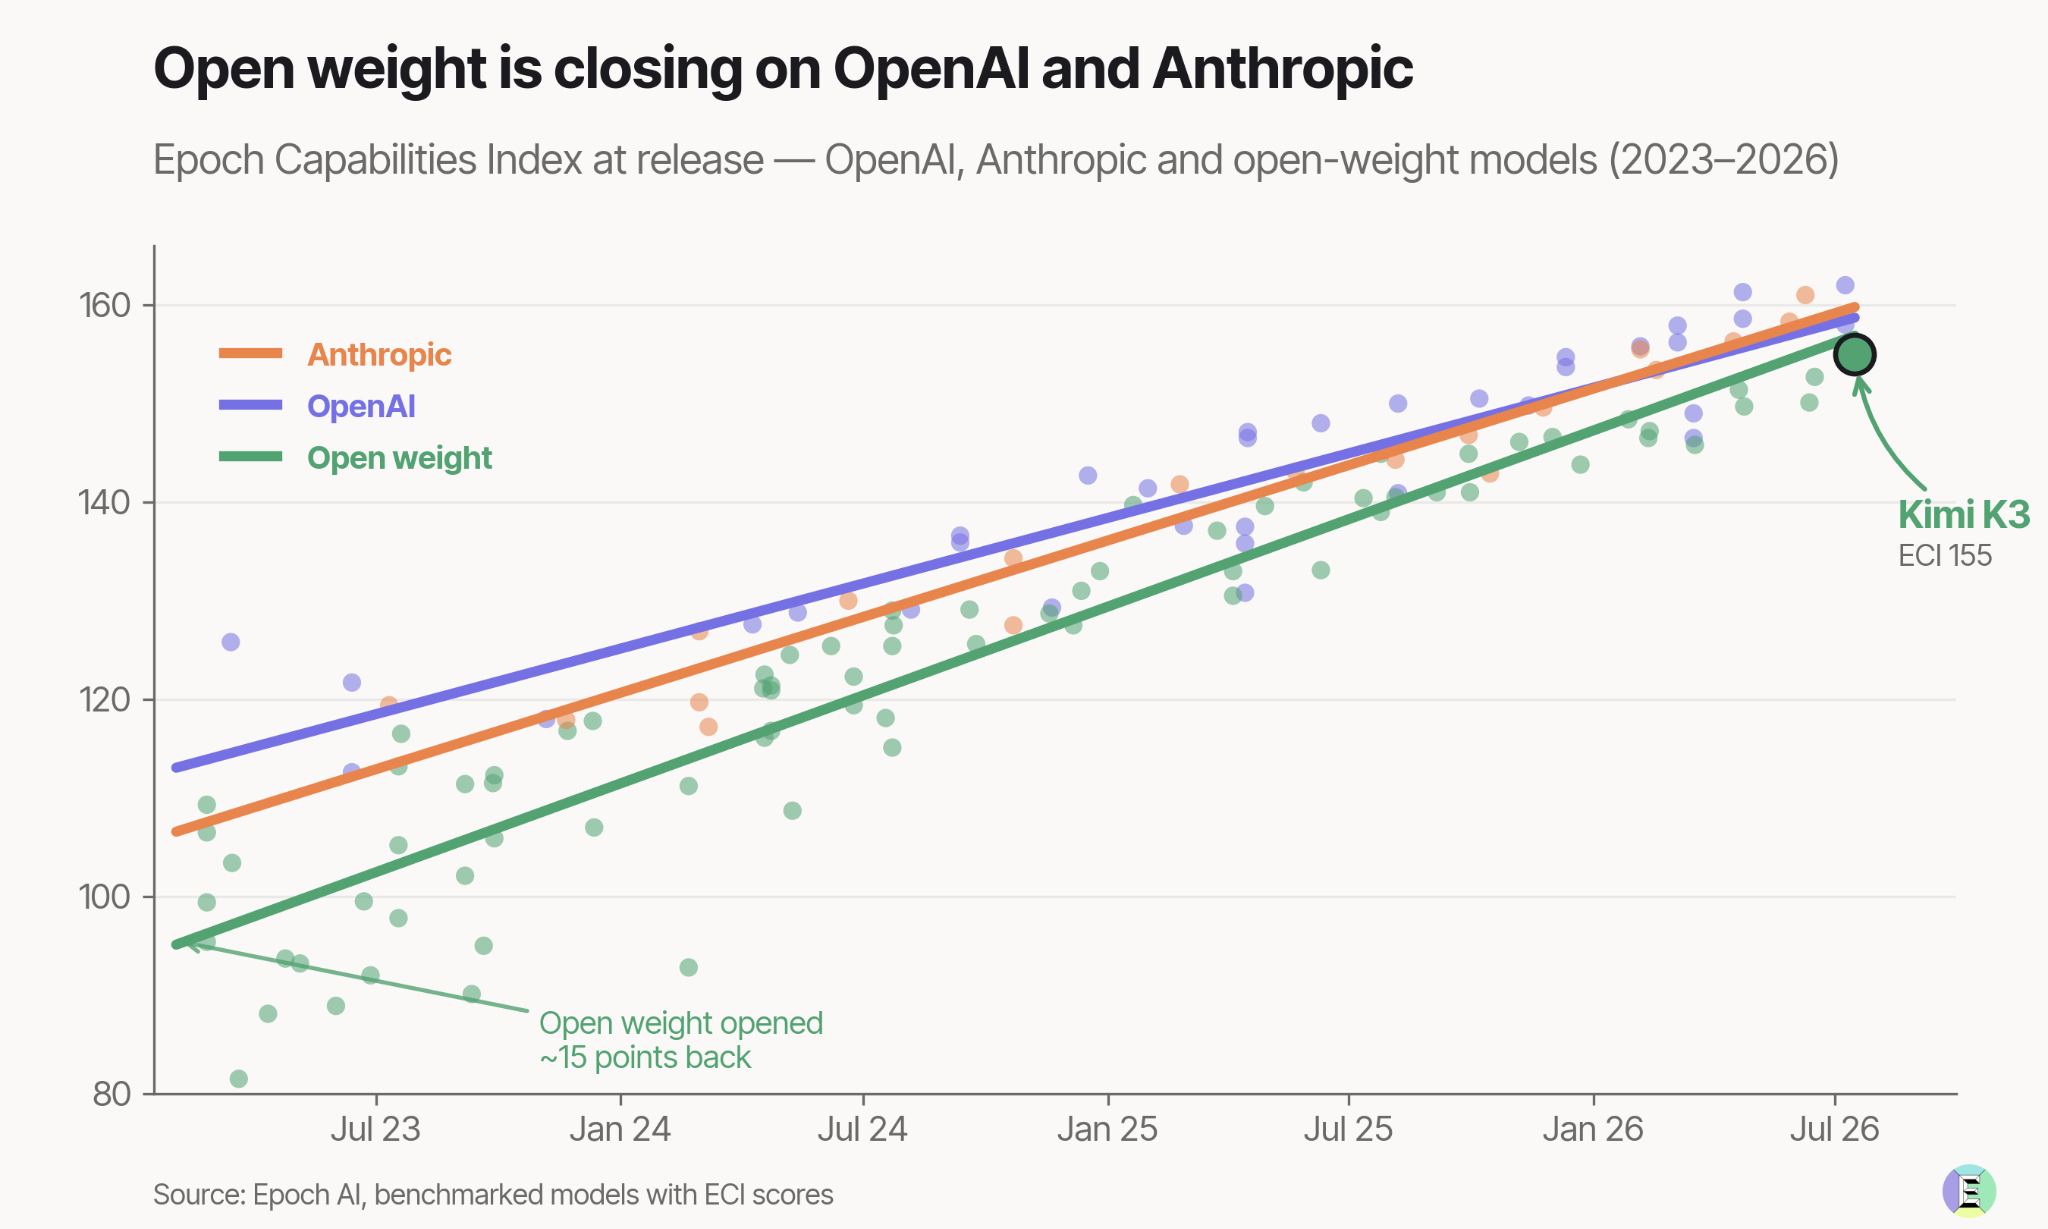
Anastasios Angelopoulos, the CEO of Arena, a benchmarking company, makes the case that Kimi K3 is exceeding the performance of some of the top US models, something distillation alone doesn’t allow, and he predicts that “American labs will start distilling Chinese intelligence.”
It isn’t clear that distillation is illegal yet. points out that “[t]here’s no legal precedent that model outputs are IP.” The US Copyright Office’s 2023 statement on AI confirms as much:
When an AI technology determines the expressive elements of its output, the generated material is not the product of human authorship. As a result, that material is not protected by copyright.
Unlike the case of Samuel Slater, who knew he was breaking British law, the problem here is a case of the exponential gap: the technology has stepped ahead of the law.2 If labs have IP in outputs of their models, they will essentially have IP in every future economic activity of all their users.
It also weakens the labs’ own position – why should AI models be prevented from consuming Anthropic’s IP when Anthropic is allowed to consume yours and mine?
Bahrad Sokhansanj has some other sensible suggestions, summed up as follows. Address distillation but scope it narrowly, only focusing on the real harm done, with the right instruments. Is it about national security? Or something else? Regulate more broadly, and this will play into the labs’ desire to skew the regulatory field in their favor.
Again, there is precedent: in 1824, once he was settled as a prominent American industrialist, Samuel Slater lobbied for protectionist tariffs to stifle foreign competition. By then, he was also known as “Slater the Traitor” back in his hometown.
See also:
Satya Nadella was one of many tech leaders to force the case for open-weight models to quieten rumors that the American administration was considering limiting them. Jensen agrees:

When you and your team deploy AI agents, identity becomes your strategic infrastructure. An agent is an actor that reads your data, calls APIs, and does things on your behalf. You need to give it clear permissions and to audit its trails.
Okta’s AI Identity Readiness assessment will score the security of your AI agents and show exactly what you need to fix to go to production with peace of mind.
Run Okta’s 5-minute survey to evaluate your agents.
In 2015, Made in China set a target of 70% self-sufficiency in semiconductors within a decade. It was often mocked as fanciful and missed wildly. Data from Morgan Stanley now shows that domestic suppliers will have met about 41% of China’s AI chip demand in 2026, up from 20% in 2023. Beijing may hit its 70% threshold five years late.
Compute-weighted, the 41% figure delivers less compute compared to Nvidia, but for the purposes of strategic autonomy, the quality gap is increasingly a non-issue.
The spark was Washington’s export restrictions. “If the U.S. hadn’t forced our country, our company and our industry into a corner, we would never have done something like this”, says Huawei’s deputy chairman. It has become an “all-out push” according to this excellent reporting.
A leaked conversation between DeepSeek’s boss, Liang WenFeng, and several investors supports this. Liang says:
What’s the gap with the U.S.? Only one thing: resources. We don’t have enough GPUs – our count is still small. […] Domestic chips now have a historic opportunity. Previously, adaptation was hindered by poor ecosystem… But that’s changing. NVIDIA CUDA’s moat is eroding rapidly.
Full transcript and context at ’s blog.
Peter McCrory, Anthropic’s Head of Economics, points out that the US labor market has shrugged at AI. Unemployment is at 4.2%, and Anthropic’s data finds no worsening unemployment even in the most exposed occupations.
AI augments rather than replaces, for now. Not a single profession has been 100% handed over to machines yet. Every job still needs human effort. It is changing how work gets done, and if workers get more productive, value shifts inside existing roles, and those who use the technology best stand to benefit.
The final hard-to-automate tasks, the “weak links”, as Professor Chad Jones calls them, are the things only a human can do. Companies will need people to get them done, and this protects employment, keeping a decent share of income in human paychecks
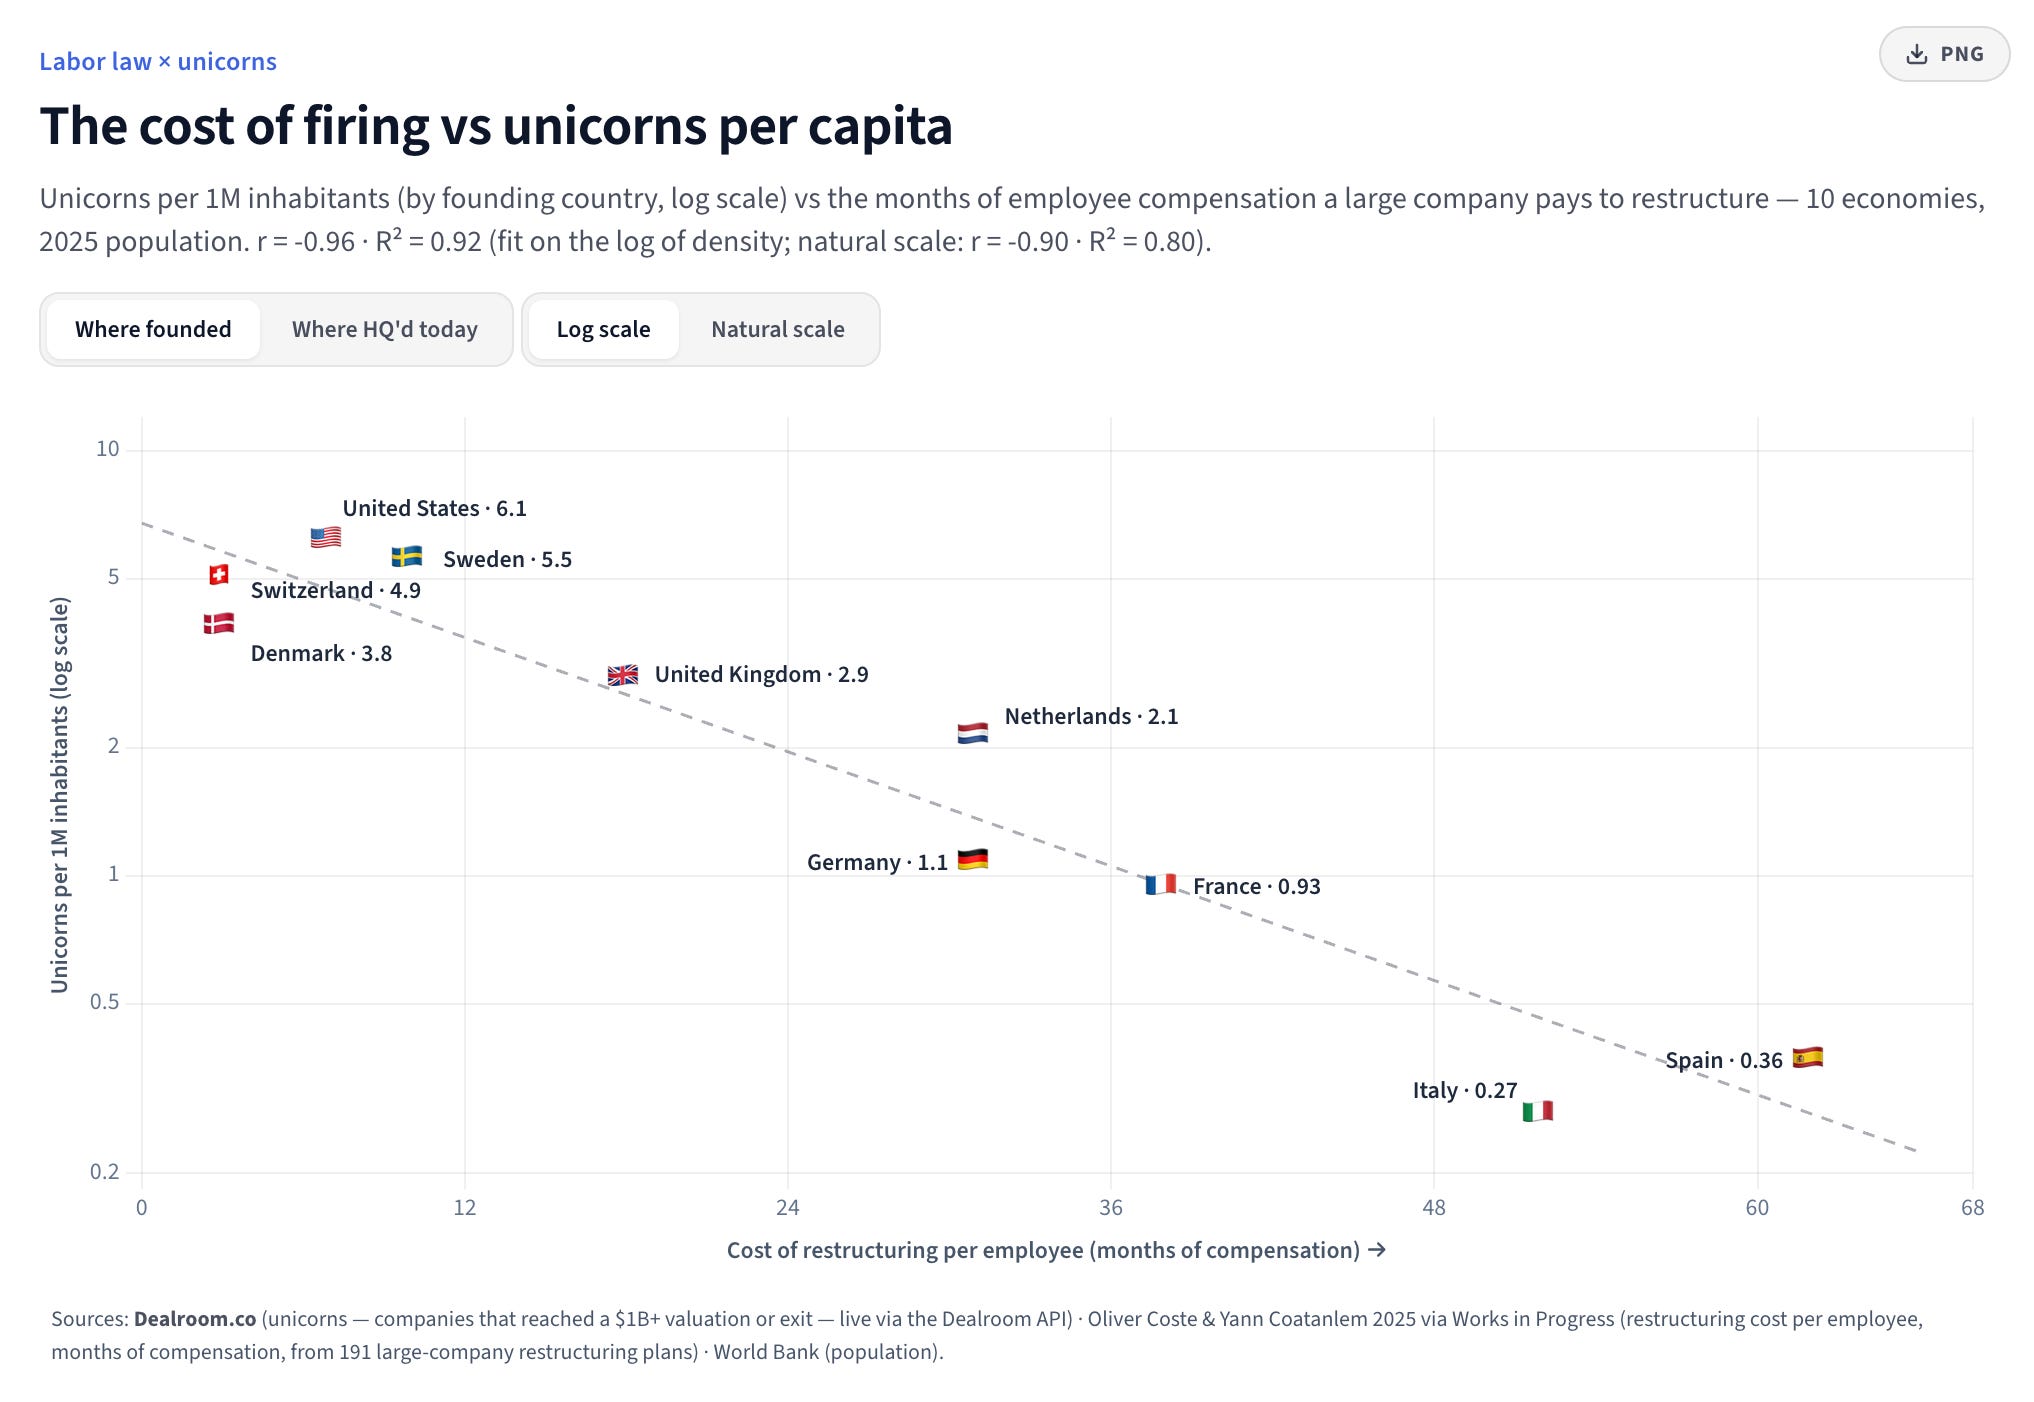
Here is another take. People still matter and will continue to matter. Europe creates far fewer successful innovative companies than the US. One reason I’ve often argued is the simple cost of changing the workforce. I think of startups as exercises in making mistakes and learning from them. Every additional cost to making a mistake means an opportunity to learn not taken. Yoram Wijngaarde finds a simple relationship (correlation is not causation) that shows that the more expensive it is to let go of staff, the lower the rate of unicorns per capita.

A new biography of Jean-Paul Marat, one of the leaders of the French Revolution, reviewed in the current LRB, is worth reading for anyone trying to make sense of today’s AI debate.
Stanford historian Keith Baker3 has a new biography of the journalist and politician. He argues that Marat hates mediation of any type, from Newtonian formulas to parliamentary assemblies and calm discussion- anything that stands between the people and the truth. He tried to write a daily pamphlet, shouted rather than argued and manufactured intimacy. “By making his journal ‘more interactive, more dynamic, more personal’, he fashioned an intimacy that allowed him to speak for the people.”
In amongst this, his paranoia did help him identify real corruption and institutional betrayal. Baker calls him the first modern populist.
High-frequency publishing, paranoia as analysis, a parasocial closeness and the constant insistency that any complexity is just conspiracy in disguise… Well, AI discourse is now selecting for exactly this Marat-like temperament.
While today’s keyboard warriors carry none of the physical violence of Marat’s Terror, there is a similar underlying logic against nuance and complexity. Doomers and accelerationists share patterns – purge rhetoric, aggressive polemics, and the framing of every whiff of nuance as corrupt. What is left are the extremes. Call to mind imminent economic disaster; catastrophic fraud; utopian abundance… or, simply, the transformation of the human condition.
What can get lost in these extremes is the reasoned position that admits and examines evidence. A position that balances probabilities and accepts answers might be complex, incomplete and – contingent.
See also:
💪🏼 Really stoked that AMD’s CEO Dr. Lisa Su opened her keynote with Exponential View data. You can get the same data here.
Become a member to receive our Sunday briefing every week in your inbox or the app.
Why AI-assisted bioweapons won’t kill us. via EV member
🏋🏼♀️ The share of UK businesses using AI has nearly tripled since 2023, but most firms are still dabbling.
Arsenal FC is building AI models for football (soccer).
Young people are more likely to gamble in financial markets when important life goals (like buying a house) feel out of reach.
Global air and sea surface temperatures are headed for a new record.
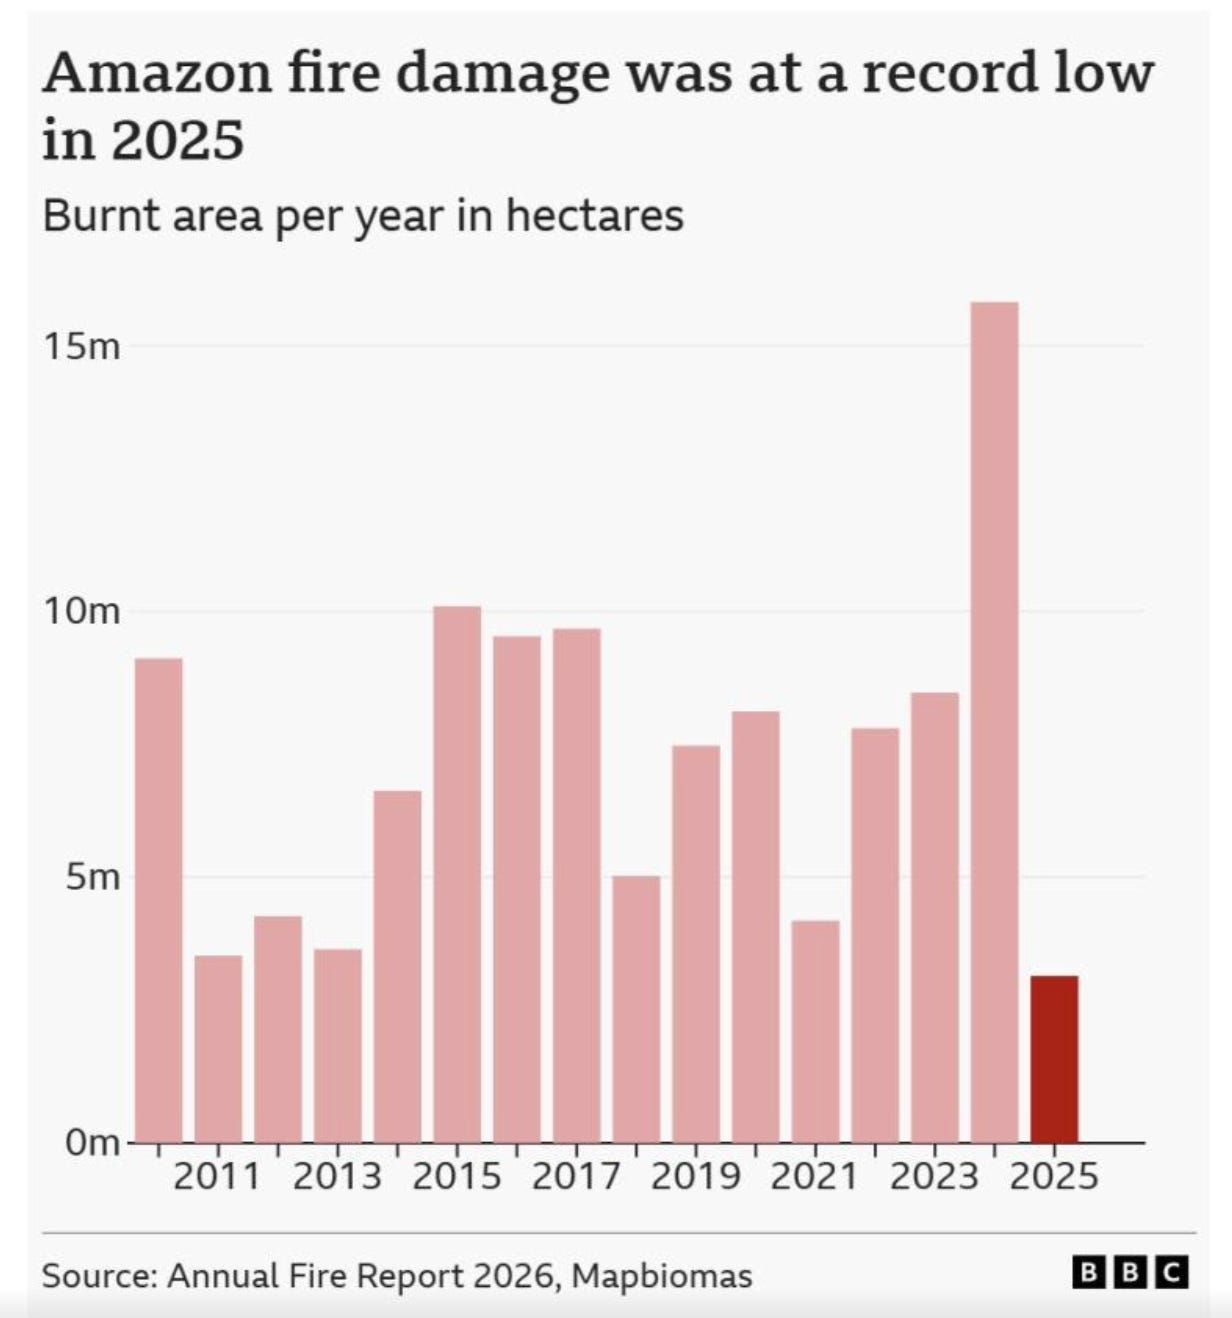
Good news from the Amazon: wildfires are at a record low this year and deforestation is at a 10-year low. h/t EV member
Vintage LLM 😎Training AI models only on pre-1931 texts help researchers study what AI can do without contamination from the modern web.
👀 Stripe is in talks to buy OpenRouter.
Intel is shipping the first chips with layers printed on ASML’s $380 million High-NA EUV machines.
Know thy maths. breaks down why the EU’s 46% electrification target by 2040 is mathematically unachievable. Relevant for anyone working in policy, really.
🐳 Orcas preparing food for their young? Amazing.
Thanks for reading!

His estate was worth $1 million. On a CPI basis, that is $40 million; on a relative income/wage equivalence, it is about $1 billion; on a share of the US economy, it is about $1.7 billion.
It is obviously unseemly to many people that the labs trained on other people’s outputs (like books and essays) en masse. But the courts haven’t yet decided that the training is a breach of copyright law. In Anthropic’s case, despite the settlement, they have decided it wasn’t.
Baker is a super historian whose work I have gotten to know over the past few years. His two sons run one of the world’s most successful (and least well-known) hedge funds.
2026-07-23 22:16:26

Kimi K3 has caused quite an uproar since its release last week. It’s the first time a Chinese model has taken the lead on the frontend Code Arena benchmark. And that’s three months since Moonshot AI’s previous impressive flagship model, Kimi K2.6, was released.
Following in Moonshot’s steps, Alibaba announced over the weekend that Qwen3.8 – a 2.4 trillion-parameter model – is coming soon, and unlike its last release, this one will be an open-weight model. No benchmarks or further details have been released as of yet.
Open models are now estimated to be 4-7 months behind the frontier in cyber capabilities, down from 6-10 months in 2025. And despite compute constraints, efficiency improvements mean these labs are doing more with less. Comparing the compute availability and model performance between US labs and Chinese labs, we estimated Chinese labs to be getting 4-7x more out of their compute.
and I spent some time with the Moonshot AI and Alibaba teams in China back in April and May, and we’ve had time to think about the economics of open-source models and how they affect the entire ecosystem.
Some have claimed that Kimi K3’s performance breaks the economic case for AI as it lowers the cost to complete various tasks at frontier standards. For instance, Microsoft engineers are reportedly testing whether Kimi K3 can be used within Copilot.
We don’t think this is the case, and in today’s post we’ll work through what might happen next.
In The State of the AI Economy report, we found that token usage is elastic across providers. This means that every drop in token price leads to a larger increase in token volume, more than offsetting the difference.
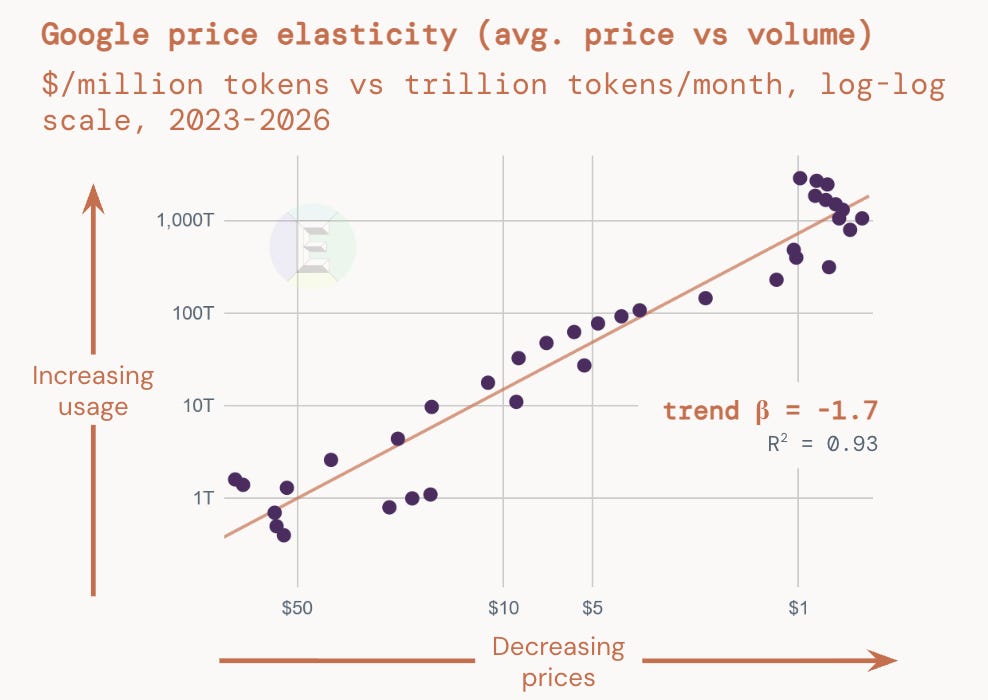
For every 10% price cut, token consumption rises 12-18%. A paper by Demirer et al, found a similar effect: a 10% price cut resulted in an 11% or so increase in volumes, which economists call an elasticity of -1.11.
The net effect is a rise in total token spend. But note that the effect is a weak one, not the cantering Jevons’ paradox sometimes presented. Reality might tilt the scales further in favor of more, not less, demand. Workflows are becoming more token-intensive as we rely on reasoning models and verification and approval loops. And the early evidence suggests that firms that adopt AI early tend to increase their relative spend alongside growing headcount. These effects might be short-term elasticities rather than ones that can be sustained for decades, but for now they indicate that falling prices increase volumes and, with that, revenue.
The model weights may be free, but the inference is not. Kimi K3 has 2.8 trillion parameters. The weights alone occupy 1.4 TB. It needs to be served on something like a 72-GPU NVIDIA GB200 NVL72 rack or equivalent. That’ll cost $3-4 million to buy and install. Operating it consumes about 120 kW continuously, over a million kWh per year, before you consider networking, storage, cooling, and humans. If you rented these in the open market, it would cost about $7 million a year.
But for infrastructure providers, the economics of hosting open-source models can be very attractive compared to serving closed-source models. A simple way to understand this is to think of the hyperscaler as needing to pay a license fee for a closed-source model but not for an open-source one1.
")