2026-05-09 04:51:02
![[Unfinished] Turning Steamdeck into a Japanese immerison machine by dual booting Windows](https://images.unsplash.com/photo-1777432033552-5b34be22ae46?crop=entropy&cs=tinysrgb&fit=max&fm=jpg&ixid=M3wxMTc3M3wwfDF8YWxsfDJ8fHx8fHx8fDE3NzgyNzA1NzN8&ixlib=rb-4.1.0&q=80&w=2000)
The dream of being able to immerse in Japanese games using all the tools you love (GSM, Luna, JL) on a handheld device has simply not been possible.
Until now.
This blog post will show you, reader who already has an immersion setup on Windows, how to do the exact same thing on the Steamdeck.
But on Steamdeck.
![[Unfinished] Turning Steamdeck into a Japanese immerison machine by dual booting Windows](https://storage.ghost.io/c/4c/7a/4c7ae3c8-8a0d-4ac2-a219-98b0b7157da6/content/images/2026/02/image.png)
We're going to do this by dual-booting Windows and SteamOS on the Steamdeck.
But firstly, why dual-boot and not go full Linux?
So why not go full Windows?
SteamOS is specifically made for the Steamdeck.
I know I do!
If you want to attempt the Linux only way™️, read this:
You should join the SteamOS Beta.
This is because it has BIOS drivers you need to make it work on Windows.
You need to set a Steamdeck password to do adminy things.
Follow this:
If you want a more hand-holdy video, this is good:
Look for "setup information" file type, right click and "Install".
It should boot back into Windows.
Connect to WiFi and install Windows updates.
Now after doing that, restart the steamdeck.
Go back to Windows updates, click on "Advanced Options" and then "Optional updates"
Update everything again.
Now let's configure Clover.
When you dualboot normally you can choose between 3 things:
I believe Clover has controller support whereas the others don't.
Open cmd as admin.
bcdedit -set {globalsettings} highestmode on
reg add "HKEY_LOCAL_MACHINE\System\CurrentControlSet\Control\TimeZoneInformation" /v RealTimeIsUniversal /d 1 /t REG_DWORD /fSets hardware clock to UTC rather than local time.
If you have ever dual booted Linux and Windows you know this is required.
Now shut down your Steamdeck, go into boot manager and boot into SteamOS.
Follow this video to fix it :)
There were some status.txt
In the docs it says:
Use this only if you have Windows installed on microSD / external SSD and if Windows keeps hijacking the bootloader!
Since I don't use that, I don't care.
Now Windows should work fine, let's optimise it to work even better.
Your life will be much easier.
Here's what I did:
Disable All Updates:
![[Unfinished] Turning Steamdeck into a Japanese immerison machine by dual booting Windows](https://storage.ghost.io/c/4c/7a/4c7ae3c8-8a0d-4ac2-a219-98b0b7157da6/content/images/2026/01/image.png)
Dual booting often breaks because Windows update breaks it.
I will disable all updates, but Windows Defender will still update its threat lists in the background so it's not all terrible.
![[Unfinished] Turning Steamdeck into a Japanese immerison machine by dual booting Windows](https://storage.ghost.io/c/4c/7a/4c7ae3c8-8a0d-4ac2-a219-98b0b7157da6/content/images/2026/01/image-1.png)
On the Config page do this:
![[Unfinished] Turning Steamdeck into a Japanese immerison machine by dual booting Windows](https://storage.ghost.io/c/4c/7a/4c7ae3c8-8a0d-4ac2-a219-98b0b7157da6/content/images/2026/01/image-2.png)
In apps install:
Now open Powershell in admin and run this:
Set-WinSystemLocale -SystemLocale ja-JPJapanese games require Japanese locale :)
And do this:
While you're there, also install Japanese language support.s
Now let's set up our mining stuff.
Set up Anki and login, sync or whatever.
Go to your Anki addons folder on Desktop (assuming you have it)
C:\Users\Bee\AppData\Roaming\Anki2\addons21
It all works.
We'll be using GameSentenceMiner.
Go to this and install it:
![[Unfinished] Turning Steamdeck into a Japanese immerison machine by dual booting Windows](https://storage.ghost.io/c/4c/7a/4c7ae3c8-8a0d-4ac2-a219-98b0b7157da6/content/images/2026/01/image-3.png)
Disable texthooker on startup.
![[Unfinished] Turning Steamdeck into a Japanese immerison machine by dual booting Windows](https://storage.ghost.io/c/4c/7a/4c7ae3c8-8a0d-4ac2-a219-98b0b7157da6/content/images/2026/01/image-4.png)
![[Unfinished] Turning Steamdeck into a Japanese immerison machine by dual booting Windows](https://storage.ghost.io/c/4c/7a/4c7ae3c8-8a0d-4ac2-a219-98b0b7157da6/content/images/2026/01/image-5.png)
I play visual novels so I don't need them to be animated 😄
But if you play games, activate animation!
I set AI up:
![[Unfinished] Turning Steamdeck into a Japanese immerison machine by dual booting Windows](https://storage.ghost.io/c/4c/7a/4c7ae3c8-8a0d-4ac2-a219-98b0b7157da6/content/images/2026/01/image-6.png)
Then set MeikiOCR in Overlay:
![[Unfinished] Turning Steamdeck into a Japanese immerison machine by dual booting Windows](https://storage.ghost.io/c/4c/7a/4c7ae3c8-8a0d-4ac2-a219-98b0b7157da6/content/images/2026/01/image-7.png)
In Advanced:
![[Unfinished] Turning Steamdeck into a Japanese immerison machine by dual booting Windows](https://storage.ghost.io/c/4c/7a/4c7ae3c8-8a0d-4ac2-a219-98b0b7157da6/content/images/2026/01/image-8.png)
Close GSM and reopen it, my OBS was not synced properly until I did this the first time.
In OBS go to settings, output and then set these:
![[Unfinished] Turning Steamdeck into a Japanese immerison machine by dual booting Windows](https://storage.ghost.io/c/4c/7a/4c7ae3c8-8a0d-4ac2-a219-98b0b7157da6/content/images/2026/01/image-9.png)
Now in Video tab:
![[Unfinished] Turning Steamdeck into a Japanese immerison machine by dual booting Windows](https://storage.ghost.io/c/4c/7a/4c7ae3c8-8a0d-4ac2-a219-98b0b7157da6/content/images/2026/01/image-10.png)
Basically all these settings say:
Finally in GSM enable "Start Overlay on Startup":
![[Unfinished] Turning Steamdeck into a Japanese immerison machine by dual booting Windows](https://storage.ghost.io/c/4c/7a/4c7ae3c8-8a0d-4ac2-a219-98b0b7157da6/content/images/2026/01/image-11.png)
Open GSM Overlay and set Yomitan up, just export your settings from your desktop and move them over.
Pro GSM tip:
![[Unfinished] Turning Steamdeck into a Japanese immerison machine by dual booting Windows](https://storage.ghost.io/c/4c/7a/4c7ae3c8-8a0d-4ac2-a219-98b0b7157da6/content/images/2026/01/image-12.png)
Go to settings -> Database Management and download the special Yomitan dictionary for character information in your games!
While you're here, set up Jiten reader. Use this for Custom Word CSS to make it look normal. The default CSS is horrific to look at.
.jiten-word.new { color: inherit !important; }
.jiten-word.blacklisted { color: inherit !important; }
.jiten-word.mature { color: inherit !important; }
.jiten-word.due { color: inherit !important; }
.jiten-word.young { color: inherit !important;}
Also in settings for Websocket remove all Websockets apart from 2333.
![[Unfinished] Turning Steamdeck into a Japanese immerison machine by dual booting Windows](https://storage.ghost.io/c/4c/7a/4c7ae3c8-8a0d-4ac2-a219-98b0b7157da6/content/images/2026/01/image-13.png)
2333 will be used by Lunahook, this saves some cpu cycles as GSM regularly checks to see if those sockets are open.
GSM keyboard shortcuts in overlay todo
Now install this:
This lets you control Steamdeck specific things like fans / gpu usage etc.
Install this:
Turn off Google translate.
Put it into Windows defender allow list so it doesn't break.
Turn on networking.
Just make sure the webhooks in GSM hook up to it.
I installed Copyparty to let me copy and paste games from my desktop to my SD:
It's like FTP but:
A lot less finicky for me.
Cause GSM records the game itself and not the window (by default), your screenshots won't be yellow.
Windows nightlight has a max limit to it, F.lux does not. You can go super red.
Use this to instantly load your gaming library on startup. Lunatranslator and GSM should auto switch to it.
Steam games do not work :/
2026-05-04 16:25:32
Hi I vibe coded this addon
it's a sorting addon for new flashcards in anki.
Other sorting algorithms:
this addon uses an advanced algorithm (I actually wrote it, but the AI implemented it. No idea if it's the most optimal, but I was going back and forth and double checking my new card order and this one looks like it works)
The idea is:
Reduce the struggle. Words with all Kanji known or only kana appear first, UNLESS there is a super high frequency word you are missing
Basically, if you know all the kanji the word is super easy so you should see it first.
it also works for other things not just visual novels
Algorithm
note:Kiku is:new -is:suspended. Review and learning cards are ignored.matureQuery or the generated matureDays query. It reads the Expression field from those mature Kiku notes and extracts kanji characters. If a kanji appears there, it counts as known.jitenFrequencyListId. The default is global. The add-on tries to use:Global snapshot when the selected list is global
FreqSort only if no Jiten data is availableExpressionFreqSort rank as fallbackFreqSort as fallbackall_kanji_known: 1.00
kana_only: 0.92
1 - min(0.18 * unknown_kanji_count, 0.54)
0.04 * coverage_score for cards that still have unknown kanjieasy_first_tiered_v1 mode still exists if you want strict buckets.preferShorterExpressions = true
There are also optional strategies, easy_first_tiered_v1 and balanced_ease_v1, but the default and recommended path is frequency_first_soft_v1.
2026-05-04 16:20:41
hi i vibe coded this super simple anki addon
go to tools -> Export Mature Words to Clipboard
It will ask you to set up your cards, like what Mature is and what Anki card field has the word
After that everytime you click this, it will export all mature words to your clipboard
No features other than that.
Use cases
2026-04-13 01:03:44
Like any Linux nerd I have been into ricing for a while, stalking the good folks over on r/unixporn and making my own Hyprland rice.
But for the past 6 months or so I've been using KDE.
And the past 2 weeks I have gone back from Wayland to X11 (it's just more stable)
This just so happened to coincide with me discovering this community:
https://www.reddit.com/r/MoeDesktop/
It's like r/unixporn but for classic 2005 otaku desktops, invoking the feeling of Moe (pronounced mo-eh).
Which just means cuteness (or something like that) in Japanese
So I thought I would try my hand at a Moe rice.
My first stop was this KDE Aero Plasma theme, since I'm a big big fan of the Vista aesthetic.
I installed it in one Paru command and it worked 🥳 My desktop does look like Vista now!!
I'm using this wallpaper from Nekopara:

It's really cute!
There's things in Python you can do to study the images colours using ImageMagik and match your colourscheme to it.
So after Aero and my wallpaper I did this!
In KDE you can edit your cursor super easily
I went into KDE cursor store and got my Miku cursor!
Like any good Otaku and doujinsoft fan I needed widgets.
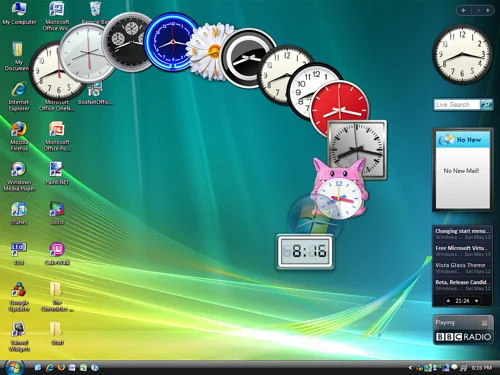
Remember how cool it was in Vista!?
So I looked at the defaults.
I added the Photo Gallery widget
Because I take so many screenshots of anime / visual novels I just pointed it at my folder.
In this game her eyes reminded me of Oshi No Ko!
Second widget is weather!
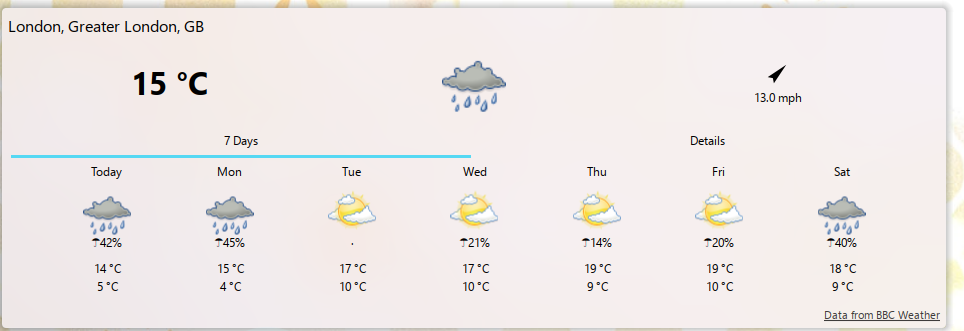
I live in the UK
Somedays it's super sunny, the next it's raining.
Last week I went to work in a coat. Everyone else was in cute dresses and skirts.... I was the odd one out :/
Never again since I added this widget!
But I had the thirst for more. MORE MOE WIDGETS!
So like any good 2026 coder I asked my AI bot to build them for me lol
Like any late 20s white girl that visited Japan, I miss it dearly
I told AI to build me a widget where once a day it'll show me a location from Japan, a photo of it, the Wikipedia description and let me click on it to go to Wikipedia:
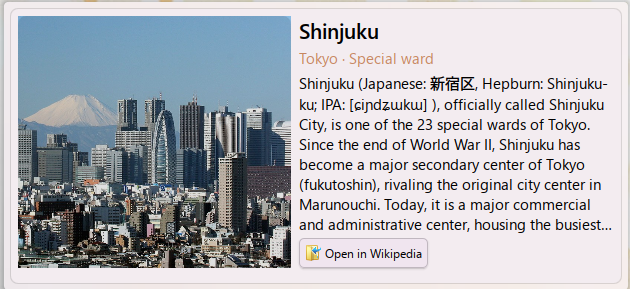
Works quite well!
I even asked it to make curated lists, so there's one for the West of Tokyo (I lived in Suginami-ku, so I miss that part in particular)
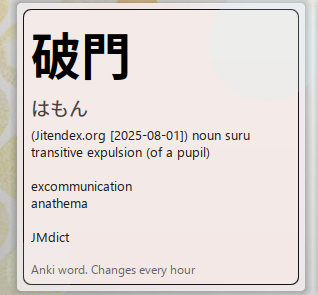
Every day (well, every hour) it picks a random word from my Anki deck and shows it to me.
No Anki? No problem!
We can change it to Local only and see a local word list of curated, fun words :)
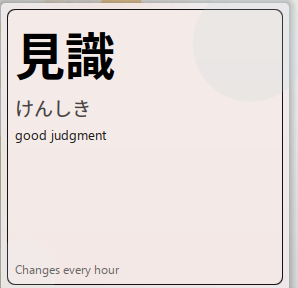
This is prettier than my Anki cards anyway, which are.... full of HTML and ugly...

I built this from a GitHub repo called Moe_Counter or something
It's just a clock, pretty cool!
Someone did this on Windows already so I just made it a KDE widget :)
I wanna see:
So I vibe coded this!

The moon is not visible in Tokyo rn
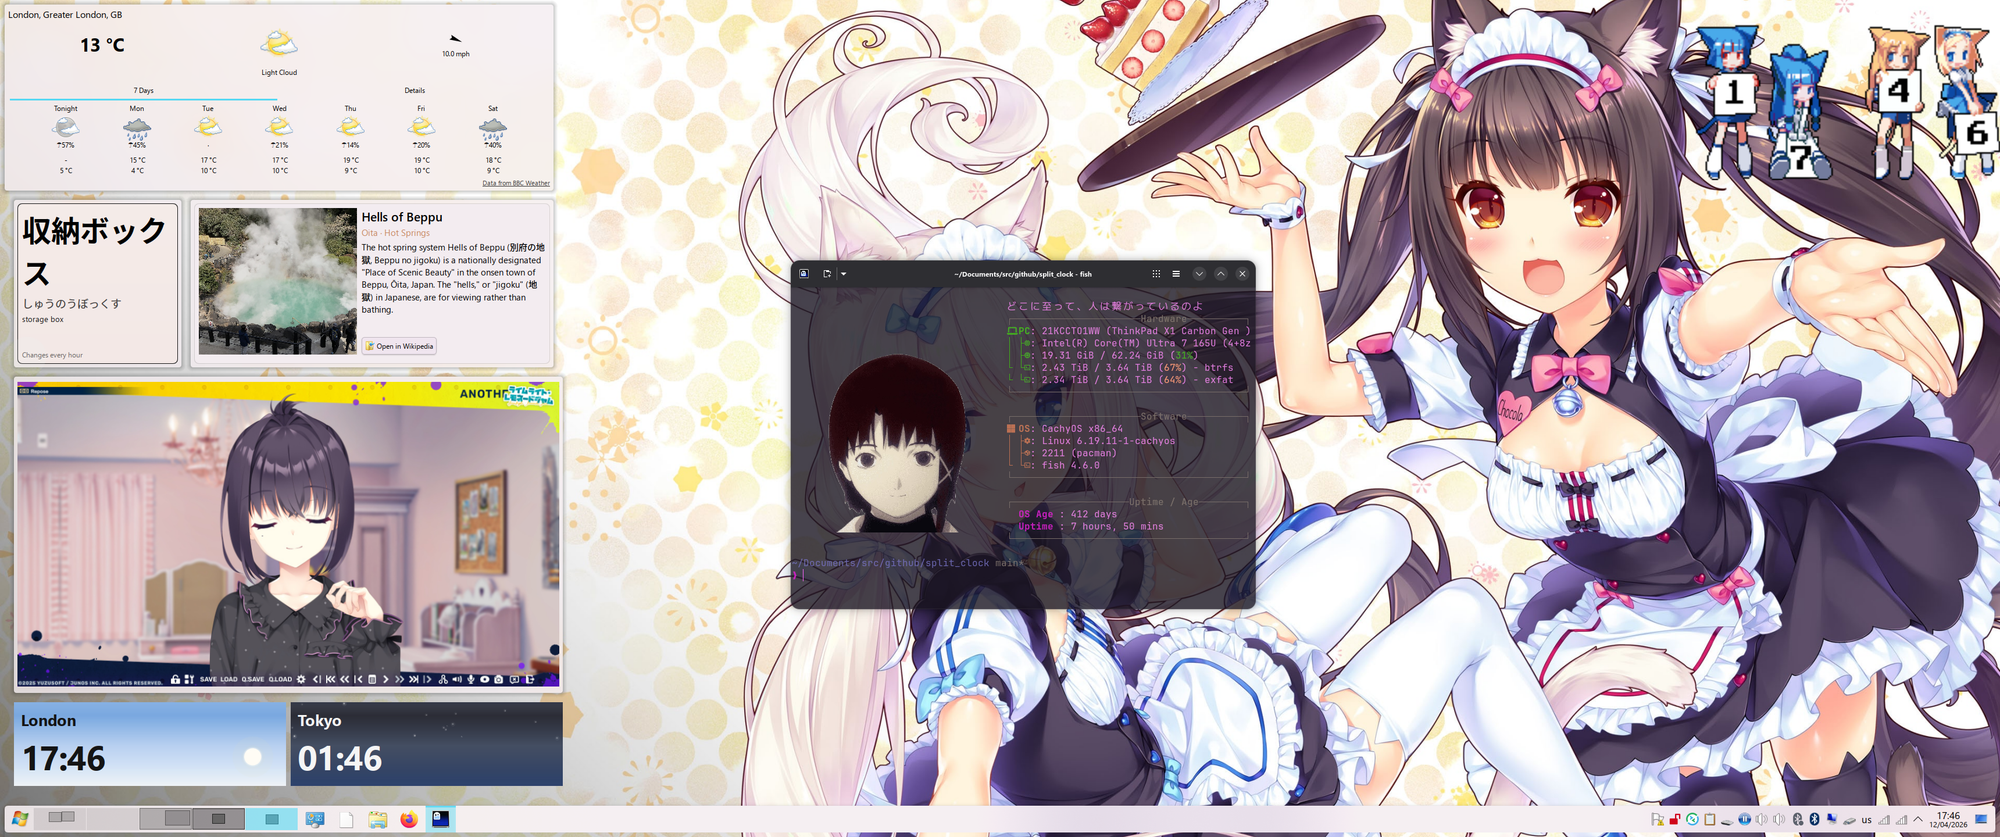
This is my current desktop!
2026-03-25 15:27:24

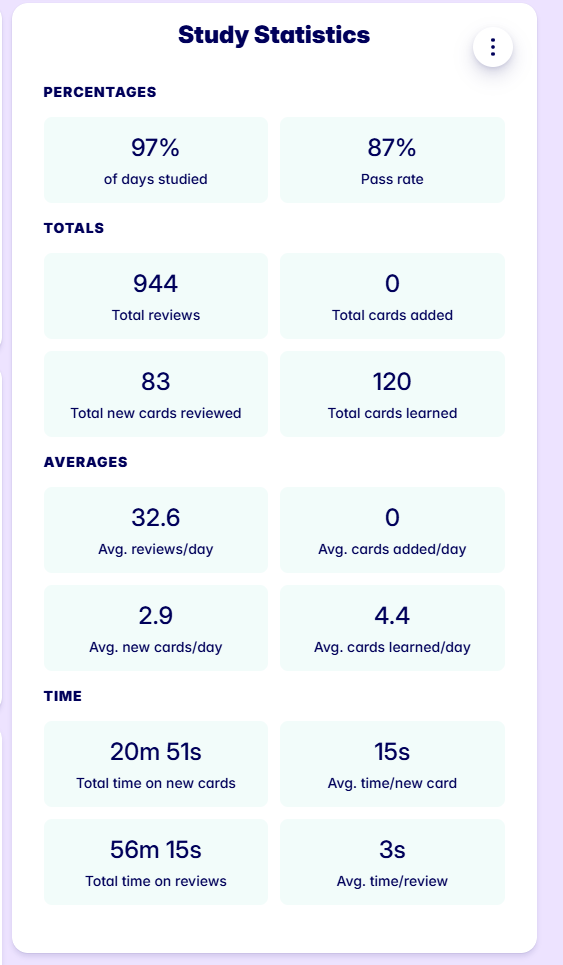
5000 words.
I hit 4000 words 87 days ago.
That's 11.49 mature words a day.
Stats since 4k words:
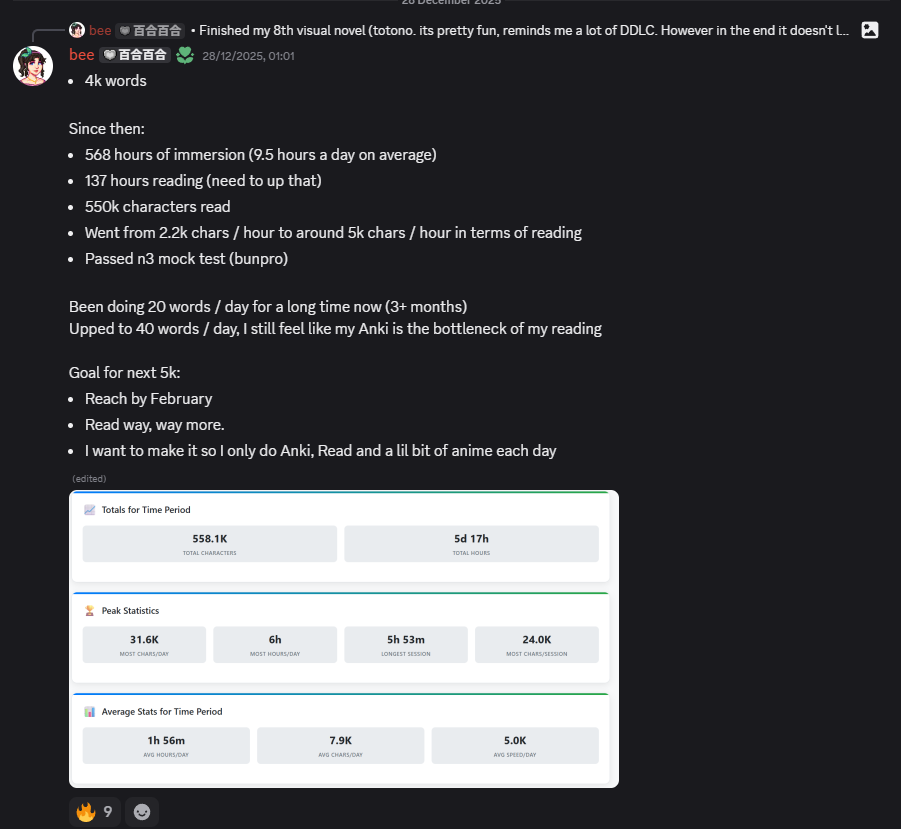
10k average daily characters.
2 hours of visual novels a day on average.
Since I hit 4k words in December:
800k chars read, 128 hours spent reading.
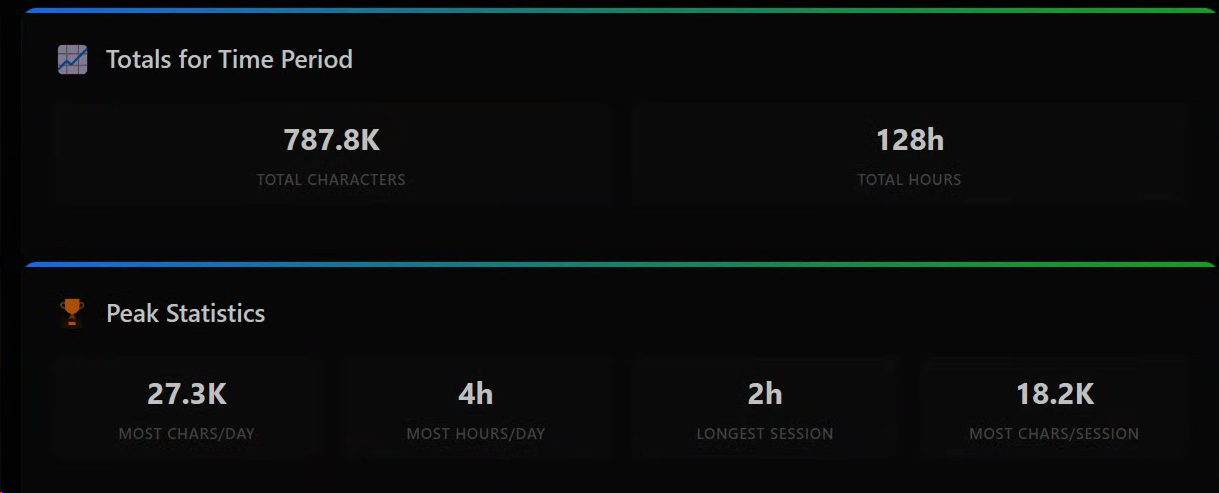
I've averaged 1 hour a day of reading (work....) and reading an average of 9.1k chars a day.
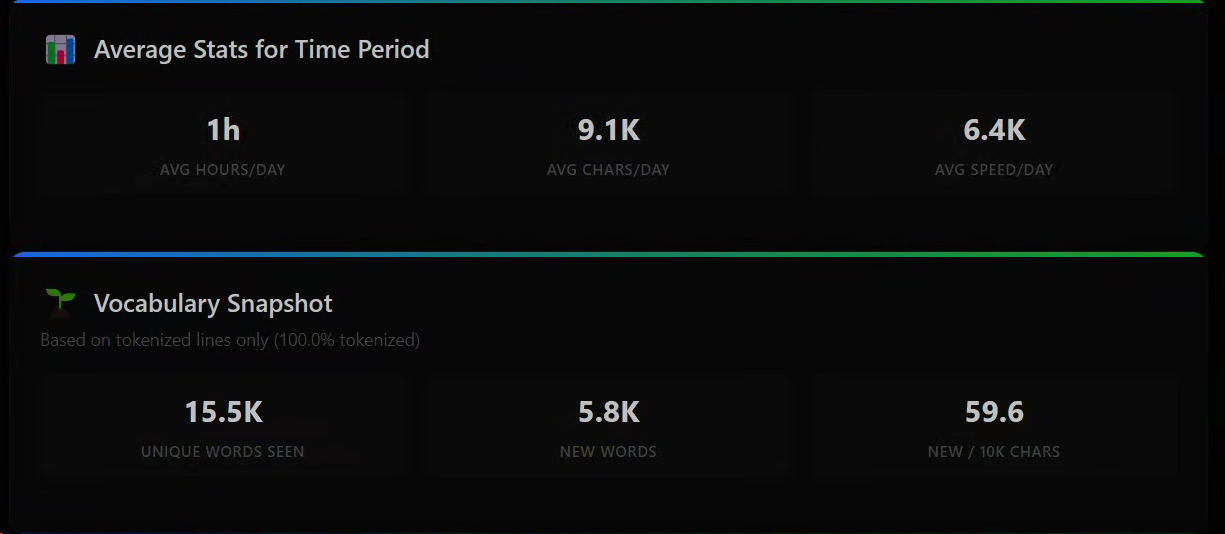
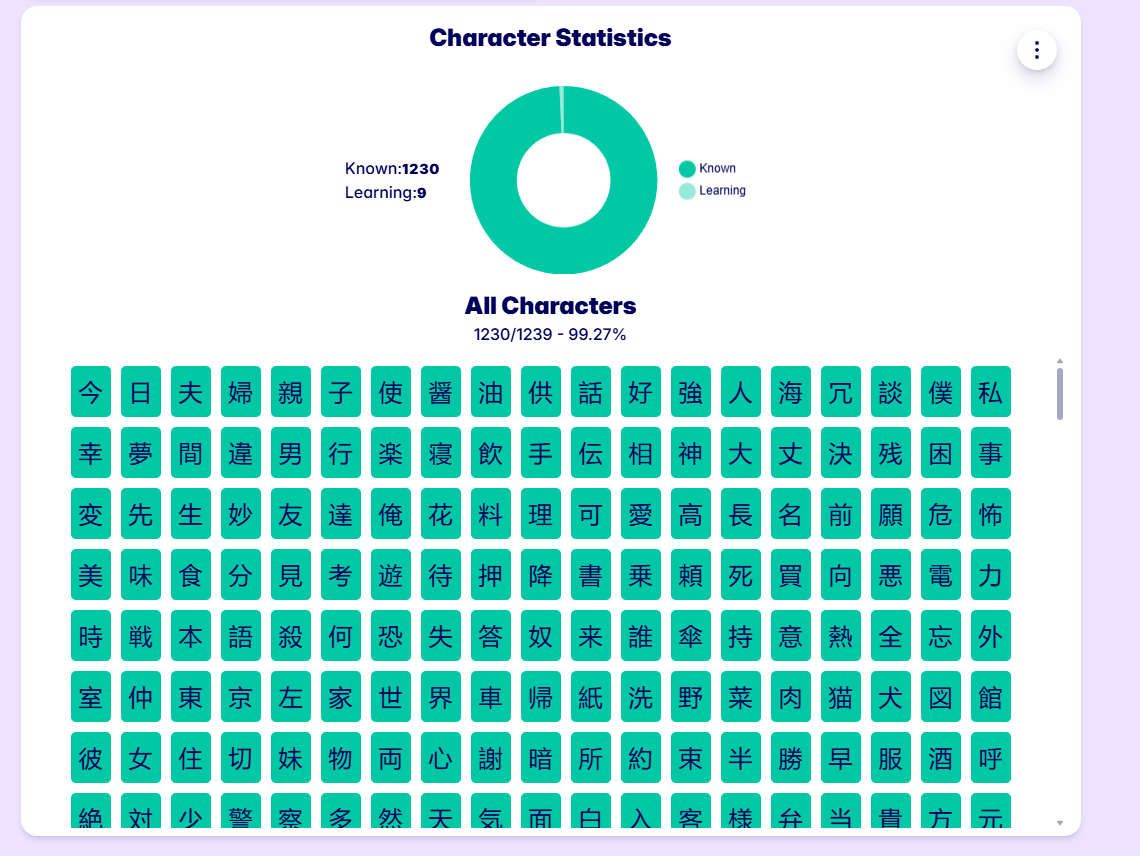
I've come across 15.5k unique words, and 5.8k of those I had never seen before.
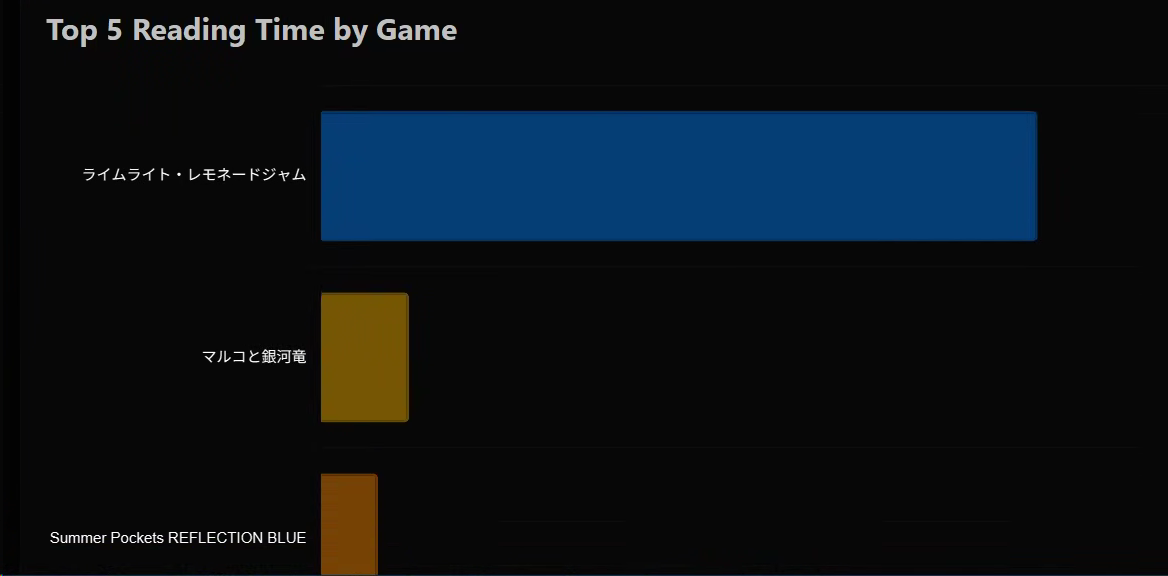
In that time I read:
In terms of Anki:
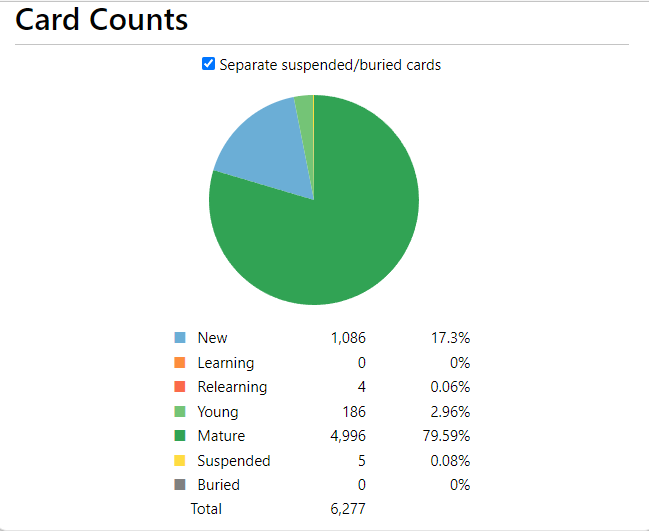
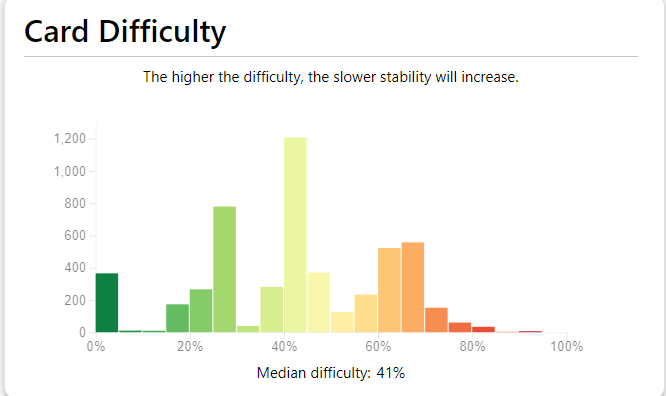
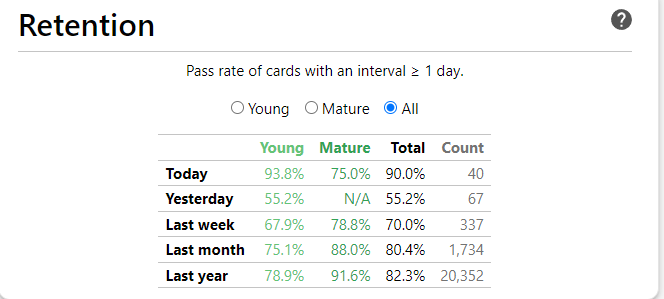
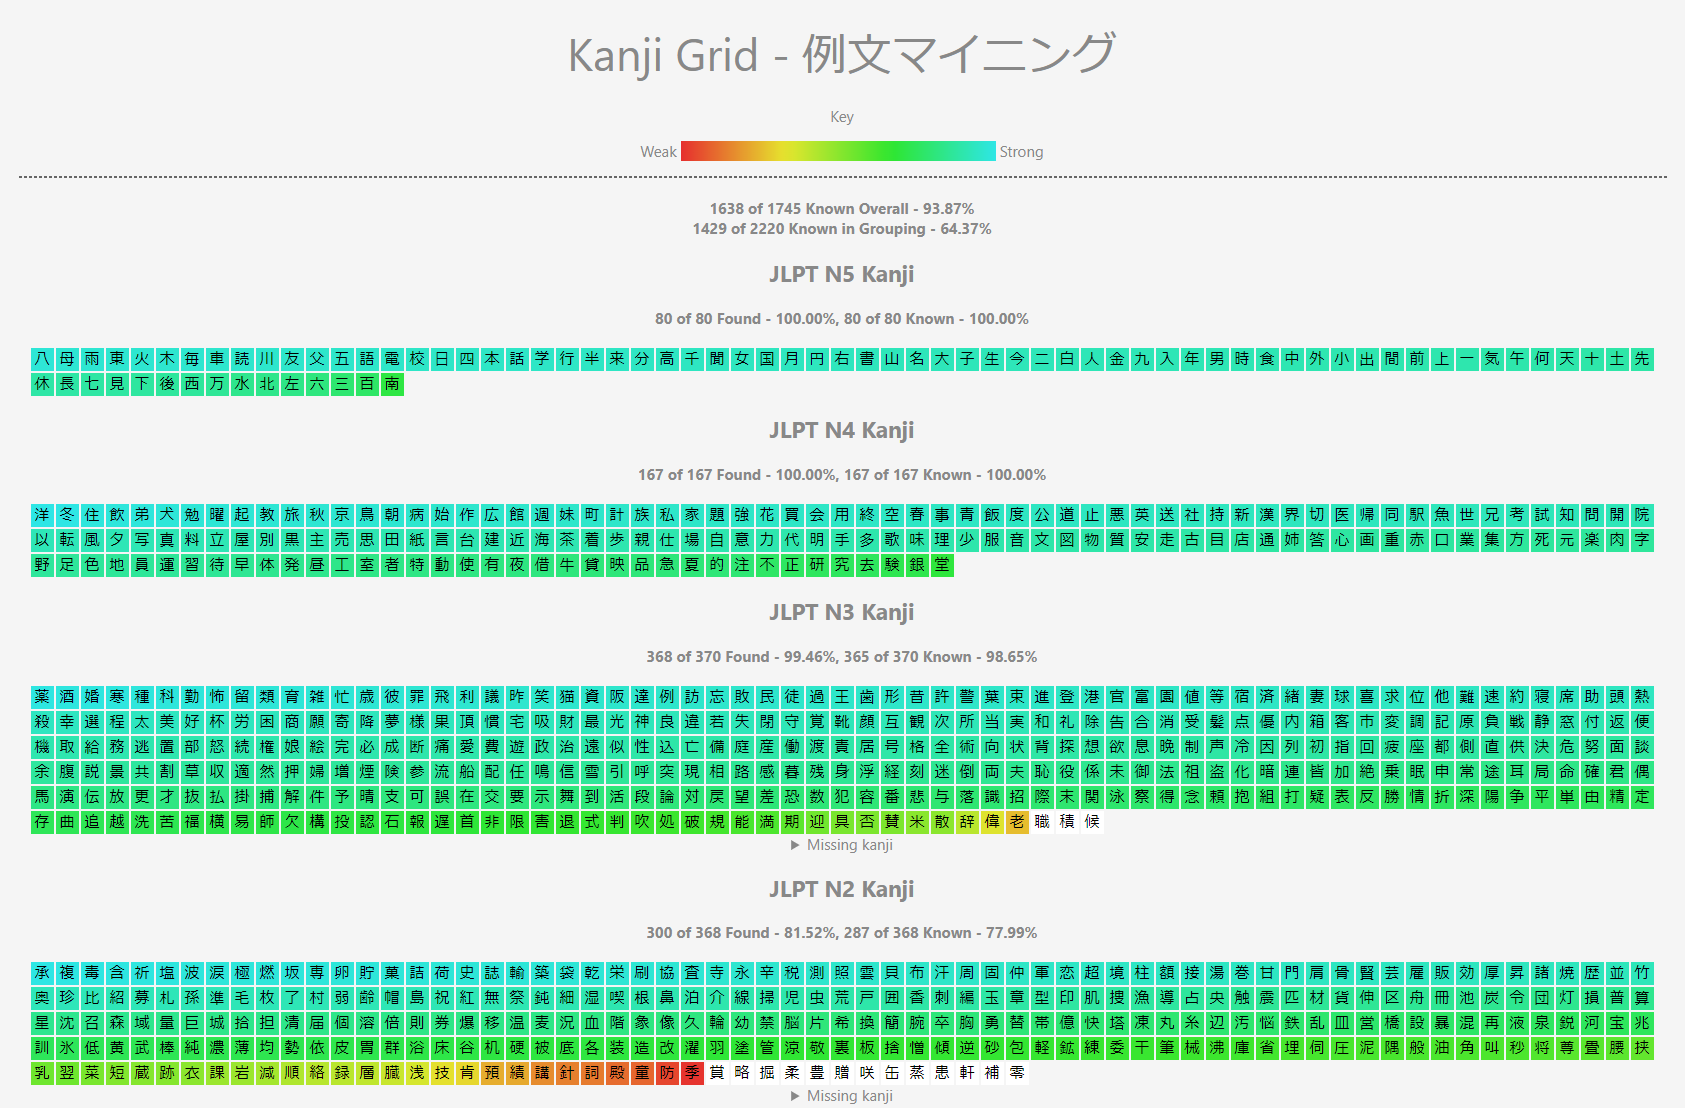
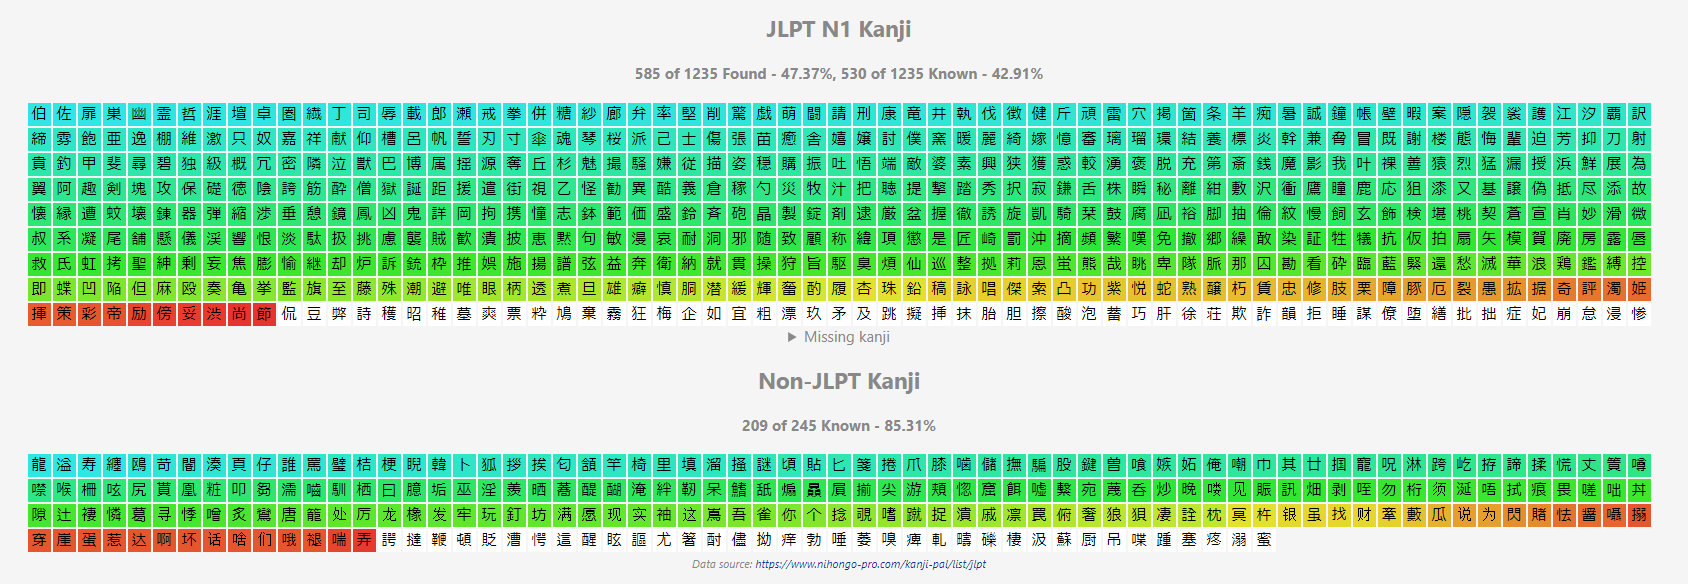
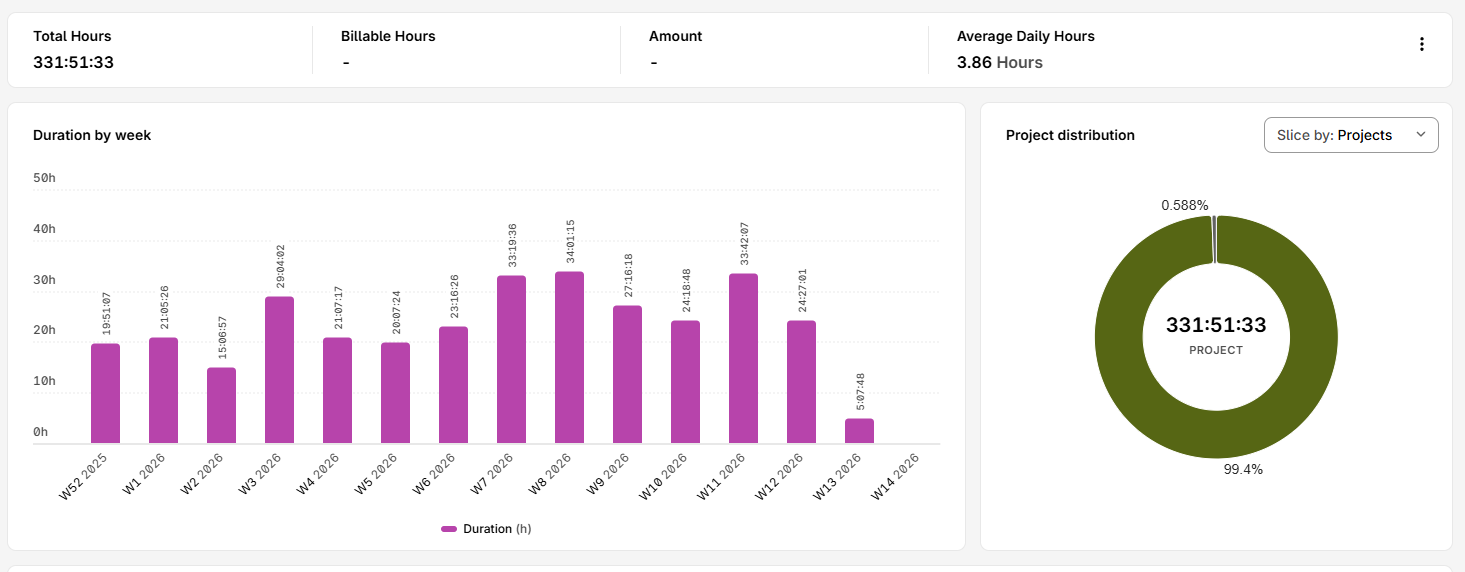
332 hours studying Japanese since 5k words.
I've been doing Migaku Memory Japanese Course for like 3 months now for funsies.

Firstly for GameSentenceMiner I added these things:
For Yomitan:
I also made an Anki addon that turns your mature words into a freq dict so you can combine both of them.
For Manabitan, a fork of Yomitan I:
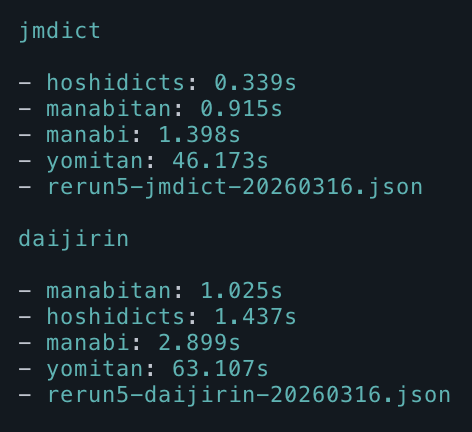
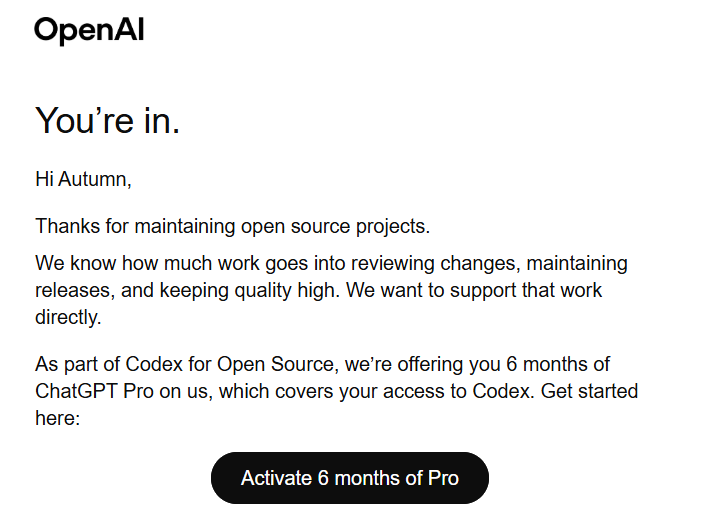
OpenAI awarded me free Codex for my contributions to the above,
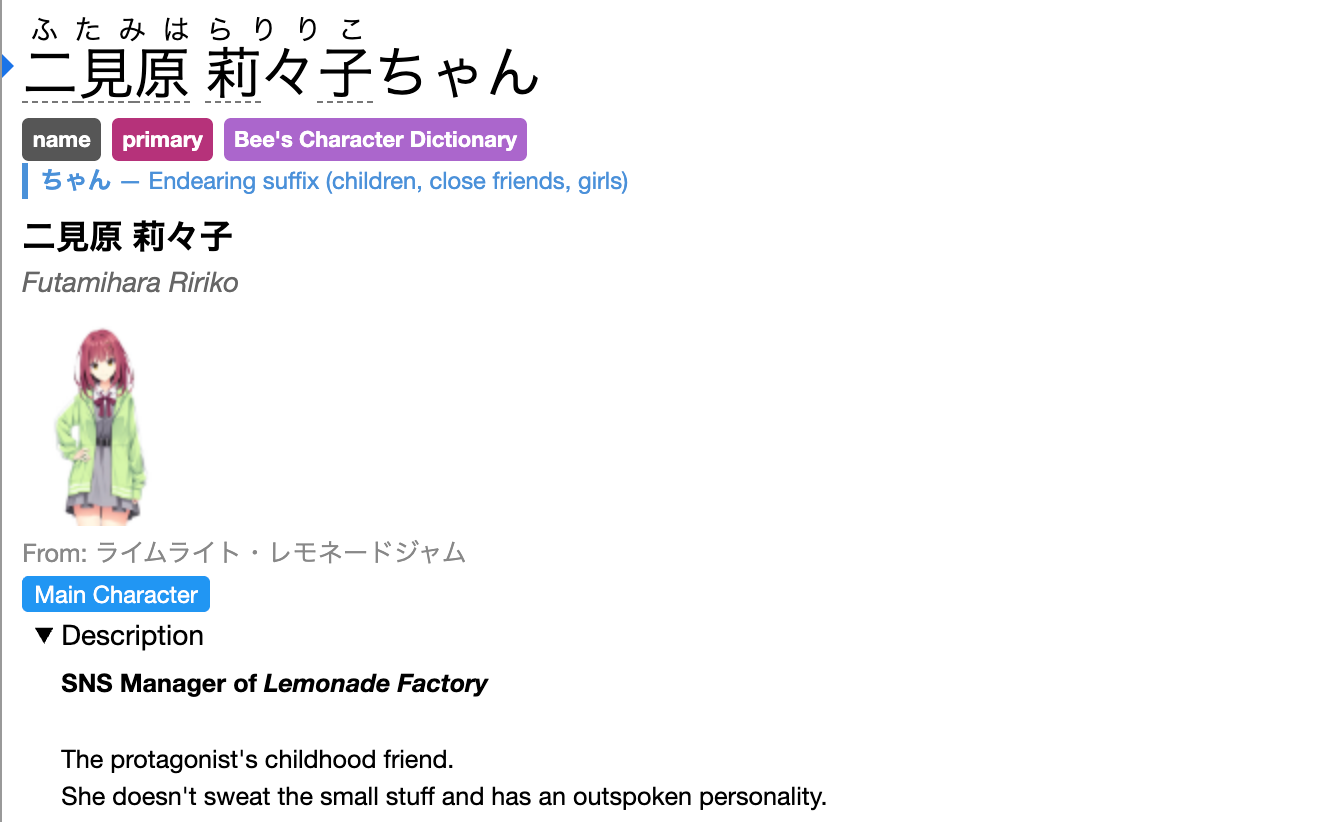
I also made Bee's Character Dictionary:
To make name dicts.
And also Bee's Custom Dict Maker for easy plaintext Yomitan dicts:
Since December I now work at FAANG so I don't have much time to immerse anymore, still it is the most important thing to me.
I currently do 10 new Anki cards a day, some number of Migaku cards if I can be bothered, and I just read a VN to finish it off.
I don't watch anime all that much, maybe 6 hours total since December.
As for manga, maybe 15 minutes...
I just read visual novels :P
My plan is to just continue this. I'm making progress, albeit slowly.
2026-02-27 23:58:15
Generate auto-updating character name dictionaries for Yomitan based on what you play/watch/read