2026-07-18 16:00:04
One of my favourite tiny details in this website is my non-breaking spaces. I have code that looks for phrases like “5 cm”, “New York”, or “Objective‑C”, and inserts a non-breaking space/hyphen so they’ll never be split across multiple lines.
This is the sort of typographical nicety that would be handled by a professional typesetter if I was writing a printed book with a fixed layout, but that’s not how websites work. My website is viewed at lots of different sizes, and browsers choose where to insert line breaks. I add these non-breaking characters so browsers know to avoid awkward line breaks.
Previously I was only applying this detail to body text, but today I implemented something similar for <code> elements.
I used a lot of inline code snippets in my last post, and while reviewing it I noticed that several of those snippets had unhelpful line breaks.
For example, (?-u:…) was split into (?- and u:…), while the flag --multiline was split with - on one line and -multiline on the other.
These line breaks make the post harder to read, with no benefit.
I can understand why they happened – browsers look for characters where they can break lines, and in English that includes hyphens. It’s usually fine to split hyphenated words over multiple lines, but it’s annoying when that happens in code.
I could fix this by replacing the hyphen in my <code> with a non-breaking hyphen, but people copy/paste code snippets and that might change the meaning.
Instead, I wrote a check that looks for <code> elements which are short and contain a line-breaking character, then adds the nowrap CSS class.
import re

def add_nowrap(match: re.Match[str]) -> str:
    """
    Add the `nowrap` class to a `<code>` element if it contains line
    breaking characters.
    """
    contents = match.group("contents")
    if "-" in contents or " " in contents:
        return f"<code class=\"nowrap\">{contents}</code>"
    return match.group(0)

text: str

# Add the `nowrap` class to <code> snippets which are short and
# contain line-breaking characters.
#
# The limit of 15 characters is arbitrary. In longer code snippets,
# wrapping is preferable to avoid leaving excessive whitespace on
# the previous line.
text = re.sub(r"<code>(?P<contents>[^<]{1,15})</code>", add_nowrap, text)
This is paired with a CSS rule that uses the text-wrap property to tell browsers not to wrap across lines:
code.nowrap {
  text-wrap: nowrap;
}
This wasn’t necessary, but I think it makes the site slightly nicer.
[If the formatting of this post looks odd in your feed reader, visit the original article]
2026-07-18 15:11:26
Recently I’ve been tidying up the subtitles in my local media library. There are two popular file formats for subtitles: SRT (SubRip Subtitle) and WebVTT (Web Video Text Tracks).
I’ve been standardising on WebVTT because it works with the HTML5 <video> element, and I play all my videos through the <video> element embedded in static websites.
However, lots of subtitles are only available as SRT, so I wrote a Python function to convert SRT files to WebVTT.
The formats looked simple and the conversion seemed straightforward.
Famous last words!
When I spot checked the converted subtitles, I noticed a bug in my handling of byte order marks (BOM), and it took several steps to fix.
A byte order mark is a special use of the zero width no-break space character U+FEFF at the beginning of a text file, which tella a program reading the file about how the text is encoded.
It depends on the exact sequence of bytes used to encode the character.
Here are a few examples:
EF BB BF – the file is UTF‑8 text.
UTF‑8 always has the same byte order, so it’s just telling us about the encoding.FE FF – the file is UTF‑16 text, with big-endian byte order (UTF‑16BE).FF FE – the file is UTF‑16 text, with little-endian byte order (UTF‑16LE).00 00 FE FF – the file is UTF‑32 text, with big-endian byte order.All of my SRT input files were UTF‑8 encoded, and some of them had the UTF‑8 byte order mark, and I wasn’t handling it correctly. For example, suppose I had this input SRT file:
<U+FEFF>1
00:00:01,001 --> 00:00:10,010
You have grown, Keyne.

2
00:02:00,002 --> 00:20:00,020
Soon you’ll be needing another name.
When I convert to WebVTT, I want to add the WEBVTT header, remove the sequence numbers, and change the timestamp format.
To remove sequence numbers, I was checking if a line was all digits. Because the BOM is on the same line as the first sequence number, the line isn’t all digits, so I didn’t remove it. Instead, I copied the entire line into the middle of the WebVTT file, BOM and all:
WEBVTT

<U+FEFF>1
00:00:01.001 --> 00:00:10.010
You have grown, Keyne.

00:02:00.002 --> 00:20:00.020
Soon you’ll be needing another name.
The correct conversion would remove both the byte order mark and that first sequence number:
WEBVTT

00:00:01.001 --> 00:00:10.010
You have grown, Keyne.

00:02:00.002 --> 00:20:00.020
Soon you’ll be needing another name.
In my local media library, I can assume everything is UTF‑8. I can safely remove the byte order marks, and my web browser will still decode my subtitles correctly.
encoding="utf-8-sig"
In my first fix, I tried to handle the BOM manually.
I wrote code that looked for U+FEFF and stripped it from the file, trying to detect it and re-insert it into the converted WebVTT file.
(This was before I realised I could just remove it entirely.)
It was a bit messy, because I was mixing low-level text encoding code with my high-level subtitle conversion steps.
As I was researching this article, I realised there’s a more elegant solution: if I open the SRT file with encoding="utf-8-sig", Python will automatically detect and skip the optional UTF‑8 encoded BOM at the start of the file.
The rest of my code doesn’t know or care that it’s there.
I fixed the bug in my function, which means future conversions will work correctly – but what about the broken files I’ve already generated?
Initially I tried searching for U+FEFF with TextMate, but it crashed consistently with that search, so I turned to command-line tools.
I use ripgrep for searching text. By default it does “BOM sniffing” on files – when it reads a file, it looks at the first few bytes, transcodes the file from its actual encoding to UTF‑8, then executes the search on the transcoded version. This is exactly how the BOM is meant to be used, but it’s less helpful if the BOM itself is what you’re searching for!
Instead, we can disable ripgrep’s Unicode support and search raw bytes by using (?-u:…) in the regular expression.
(This flag comes from Rust’s regex crate.)
The following command looks for lines that start with the UTF‑8 BOM:
$ rg '^(?-u:\xEF\xBB\xBF)'If you were only looking for the BOM at the start of the file, you’d also want the --multiline flag.
That changes the caret ^ to anchor to the start of the file, not the start of any line.
But since I’m looking for BOMs which are in the middle of the file, omitting --multiline is correct.
This search threw up dozens of files with a broken BOM. Initially I opened the broken files in TextMate and edited them manually:
$ rg --files-with-matches --null '^(?-u:\xEF\xBB\xBF)' | xargs -0 mateBut I quickly realised this was too slow, so I wrote a Python script to clean up all the files at once:
#!/usr/bin/env python3

import glob

for filepath in glob.glob("**/*.vtt", recursive=True):
    with open(filepath, "rb") as f:
        content = f.read()

    if b"\xef\xbb\xbf" in content:
        content = content.replace(b"\xef\xbb\xbf", b"")
        with open(filepath, "wb") as f:
            f.write(content)
        print(filepath)
Once I’d run this script, I used my ripgrep command to check it was correct – and indeed, all the erronous BOMs had been stripped from my media collection. I also track my subtitle files in a Git repo, so I could confirm the script didn’t introduce other changes.
Before this bug, I’d only vaguely heard of byte order marks, and I’d never had to tackle them in anger. This sort of lesson is exactly why I love managing my local media archives as hand-built static websites – the lo-fi approach gives me lots of opportunities to explore low-level ideas and learn how things actually work on my computer.
[If the formatting of this post looks odd in your feed reader, visit the original article]
2026-07-14 04:44:05
At work, we use a standard Git workflow: develop on a feature branch, push to GitHub, and open a pull request to main.
Once somebody else approves the PR, the changes get merged.
At least once a week, I forget to branch and commit changes directly to my local main.
I only realise my mistake when I try to push and GitHub blocks me.
To untangle myself, I have to create a new branch with my current state, push that instead, and then reset my local main back to origin so I can pull other people’s changes.
This isn’t difficult to fix, but it’s annoying – especially when I often forget to clean up my local main until the next time I try to pull.
To stop me getting into this state, I’ve written a Git pre-commit hook.
I saved the following shell script in .git/hooks/pre-commit and made it executable:
#!/usr/bin/env bash

set -o errexit
set -o nounset

branch="$(git rev-parse --abbrev-ref HEAD)"

if [ "$branch" = "main" ]; then
   echo "You can't commit directly to main"
   exit 1
fi
The git rev-parse command prints the short name of the current HEAD.
If I’m on a branch, it returns the branch name; if I’m in a detached HEAD state, it returns HEAD.
If the hook detects that I’m on main, it exits with an error code.
This aborts the commit and prevents it being saved, serving as a friendly reminder to create a feature branch first – and leaving my local main completely clean.
Ideally I’d always remember to branch when I start a new piece of work – but since I don’t, I’m happy to let the computer remember instead.
[If the formatting of this post looks odd in your feed reader, visit the original article]
2026-07-06 02:01:19
I take a lot of photos, but I only keep a fraction.
Every week, I go through my camera roll and sort my photos into three buckets: keep, delete, or “needs action” (pictures like paperwork or screenshots that I need to do something with, but don’t want to keep indefinitely). This lets me filter out repetitive, blurry, or uninteresting shots.
A few years ago, I reviewed my entire 30,000 item library and I deleted almost a fifth of my photos, but I haven’t missed any of those photos. If anything, browsing my photo library has been nicer, because the average quality went up. My photo library only contains my best pictures, not just everything I’ve ever taken.
Recently I added a new step: I now write a description for every photo I’m keeping. Typically the description is a sentence or two of context, like what I was doing when I took the photo, or how I felt when I did. A lot of this context isn’t obvious from the image, and over time I forget those details. Sometimes I can piece it together later from my calendar or journal entries, but other times I just have a mystery image and I can’t remember why it was important.
This slows down the review process, but it only takes a minute or so per photo, and each description makes the photo library a more useful visual record of my life. When I revisit those photos, the memory is stronger because I recall more of the context.
This change has forced me to be more thoughtful about which photos I keep. If I can’t write even a sentence or two about what this photo means to me, is it worth keeping? Will I ever look back on it with fondness?
Even this minimal level of descriptive text is quite unusual. When I was working on the Data Lifeboat project, a lot of the early designs were built around rich uploader-supplied metadata, like title and description. These designs fell short in practice, because most people leave them empty. The vast majority of Flickr pictures don’t have a title or description, and those are photos people want to share! (The auto-generated filename from the camera doesn’t count.)
I’ve already written descriptions for about 5% of my photo library, and that number will gradually ratchet up. I’m writing a description for every new photo, and I’m slowly working backwards while the memories are still fresh.
I really recommend writing descriptions for some of your photos, whether that’s in a social media post, your digital photo library, or a printed album. A sentence of context can really anchor a memory.
If you open your own camera roll and look at the last photo you took, do you remember how you felt in that moment – or is it already starting to slip away?
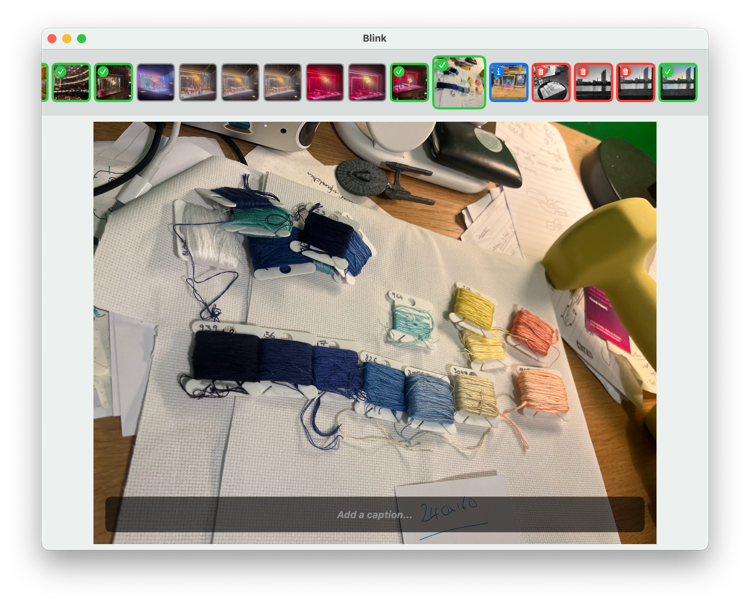
Initially I was adding descriptions using Apple’s Photos app, but I really wanted to include them in Blink – a tiny Mac app I wrote a few years ago to review my photos. Blink lets me sort my library entirely using keyboard shortcuts, and I wanted to write descriptions without breaking that fast, mouse-free flow.
The Blink interface is intentionally sparse: there’s a horizontal thumbnail strip at the top, then the focused photo takes up most of the window.
I use arrow keys to switch between photos, and I press 1/2/3 to categorise them (keep/delete/needs action).
To add descriptions, I added an overlay at the bottom of the window. It shows the current caption, or a placeholder if I haven’t set one yet:
If I press space, the overlay switches to a text field where I can enter a new description, or edit the existing description:

When I press ⌘+Enter, the description is saved to the “caption” field in my photo library. I never have to take my hands off the keyboard, so this doesn’t introduce much friction to my workflow.
Adding this to Blink was a fun exercise in revisiting old code.
Blink is written as a Swift app using SwiftUI, and this was my first time working with Blink and SwiftUI since September 2023. I’ve written short command-line scripts in Swift in the interim, but not a GUI app.
It took a while to get comfortable working in the Blink codebase again.
As always, I wish I’d left more comments and documentation when I wrote this code.
Names like FocusedImage or AssetHelpers clearly meant something three years ago, but I’d forgotten the meaning and had to relearn it.
Comments are something I can always get better at. I was fortunate to start my career at a company that had a very verbose commenting style, so I learnt some good habits early, but then I cycled through a few jobs where the standards were more lax, and my comments suffered. I was in the middle of that period in 2023, and the Blink code reflects that. My current workplace has a much stronger commenting culture, and I can feel that muscle strengthening again.
If you read my patch to add captions, you’ll notice it has much more commentary!
I consider Blink to be a tremendous success. I’ve used it to review thousands of photos since 2023, transforming my photo library from a digital dumping ground to a curated collection of highlights.
I initially wrote Blink as an experiment to learn SwiftUI and Mac development. I’d have been happy if I never used the code, but instead, it’s become an app I use every week.
As far as I know, nobody else has ever used it. The source code lives in a public repo, but it’s for educational interest rather than distribution. (The code is so tied to my machine that it crashes if pointed at anybody else’s photo library.)
I’ve considered cleaning it up, packaging it, and turning it into a “proper” app that other people could use, but that’s a lot of work I don’t find exciting, and it’s unclear if there’s any interest among people who aren’t me.
For now, Blink will continue to have exactly one user. That user doesn’t need an onboarding flow, a settings screen, or cloud syncing. They just want a keyboard-driven app to curate their photos, and write down the context before the memories disappear. For that user, it’s a five-star app.
[If the formatting of this post looks odd in your feed reader, visit the original article]
2026-07-03 23:52:05
Yesterday at work, a customer spotted a typo in our UI: “you can use the use the Tailscale CLI”. After the typo was fixed, I wanted to find other cases of accidentally repeated words or phrases. I used two regular expressions to search every codebase for unnecessary repetition.
The first regex finds repeated words:
\b([A-Za-z]+) \1\b

Backfill product data from from Stripe
Learn more about about inviting users
Argument must be be one of host name, IP set name, IP prefix, or IP
There’s a capturing group for a single word made up of letters ([A-Za-z]+), a space, then a backreference to the group.
I used [A-Za-z] rather than the word metacharacter \w because I didn’t want to include numbers, which would dramatically increase the number of matches in a codebase.
This skips repetitions which include accented characters, but that’s fine because those are rare in my writing.
That expression is surrounded by word boundary assertions \b, which check that I’m at the start/end of a word – this avoids finding repeated character sequences within longer words, like “with the reason”.
The second regex finds repeated phrases:
\b([A-Za-z]+ [A-Za-z]+) \1\b

Follow the steps in the in the "How to" section
Log in to in to your account
To configure federated identities federated identities using the Go SDK
I’ve changed the capturing group, so now it looks for two words separated by a space.
Sometimes repetition is useful, like when I really really want to emphasise a point, but often it’s just a typo. Cleaning up these mistakes has been a fun Friday cleanup task.
[If the formatting of this post looks odd in your feed reader, visit the original article]
2026-06-29 16:28:13
One of my distinct memories of childhood is the “computer room”. When I was young, computers weren’t a ubiquitous feature of our lives; they were bulky appliances with a fixed location, and you had to go somewhere to use them.
At home, it was my parents’ study. The first computer I remember using is their iMac G3, which is about as portable as a small tree.
At my grandparents’ house, it was their office in the corner of the house. Their desktop PC was far from the kitchen, bedrooms, and living room, sandwiched between the coat rack and the washing machine.
At school, it was classrooms with computers shoved in haphazardly, maximising the number of screens above all else. Outside the IT department, computers had their own desks. If a teacher wanted to use the computer in their classroom, they’d get up from their regular desk and move to the computer chair.
Even in buildings which didn’t have a dedicated room, computers still had a fixed location. If you wanted to use a computer, you had to go to it – whereas today, computers follow us around.
The laptop was the first device to test the walls of the computer room. Early laptops were limited compared to desktop computers – they were slower, battery-constrained, satellite devices to your main machine. If you wanted files on your desktop to be available on your laptop, you had to copy them manually using a floppy disk or a flash drive. You could use them to work from the sofa or the kitchen table, but they were so compromised that it was rarely your first choice.
Over time, laptops got better. They got faster processors, better battery life, and wireless networking. Laptops became more convenient for more types of task, and soon they were good enough to be your primary computing device.
Laptops promised a previously unknown level of computing freedom, the idea that you could now work from anywhere – a beach, a coffee shop, a couch. We welcomed the change, because the physical constraints of a desktop computer suddenly felt like an unnecessary friction.
Yet, some physical restrictions remained – laptops were still heavy and bulky objects. They were something you had to carry in bags, and not something you’d take out casually. There were lots of places where you’d never see or use a laptop.
Smartphones followed a similar trajectory to laptops. Early models were compromised, limited, and companion devices to “real” computers. I still remember what a big deal it was when Apple announced that iOS 5 would allow you to set up an iPhone without plugging it into a computer first – something we take for granted today. Over time, smartphones evolved in capability and performance, and for many people a smartphone is now their primary computing device.
The smartphone could go places the laptop never could – pockets, bathrooms, bedrooms. The compact size meant they could be carried anywhere, and in previously computer-free spaces it became easy to glance down at your phone. Computers had well and truly escaped the boundaries of the “computer room”, and could go with us practically anywhere.
The miniaturisation required for smartphones allowed tech companies to take this even further, and is now used in wearable devices like watches, glasses, and pins, allowing computers to maintain a permanent physical presence in our lives.
Unlike many trends in consumer technology, the shift towards portable computing wasn’t forced upon us by tech companies; it was something we actively welcomed. We fell in love with the convenience. The ability to work from a coffee shop, watch TV in bed, or answer messages on. a packed commuter train made computers more useful.
The smartphone tooked this further, pairing portability with consolidation. A single multipurpose device could fulfil the functions of a dozen single-use gadgets. The logic seemed sound: why carry a separate iPod, camera, dictaphone and notebook when one pocket-sized device could do all that, and more?
I don’t want to underplay these benefits – these changes have made computing more affordable, accessible, and useful. It would be disingenuous to argue that things were better when I was younger, or to suggest that we all go back to desktop towers. But this trend isn’t all good, and recently I’ve been more aware of the downsides.
Making computers more portable didn’t just make it easier for us to get to digital services; it made it easier for digital services to get to us.
Mediated by the smartphone, apps and websites now have a permanent, physical presence in our lives. A notification can reach us at any time, in any place – a phantom tap on the shoulder, distracting us from the physical world. These surfaces have become weaponised, and enormous resources are spent on designing addictive environments to maximise the time we spend within them.
I see the effects of this in my own behaviour. I check my phone every few minutes, not because I’m expecting a message, but because I’m waiting for that next dopamine hit. It’s become a reflex, a digital itch I’ve been trained to scratch, whether or not there’s anything worth seeing. When nothing arrives, I fill the silence with scrolling. I cycle repeatedly through the same few sites, looking for something new, glancing at content for seconds before moving on.
We’ve never found ourselves in a more aggressive information environment, and the physical proximity of our devices makes it hard to escape. This assault on our attention is not something our brains have evolved to cope with.
I don’t want to deny the benefits of portable computers, or the freedom of unshackling ourselves from a desk – but increasingly I find myself wishing for the walls of my childhood computer room. I long for the boundaries it once enforced, and the physical restrictions it put on the competition for my attention.
Over the last year, I’ve been trying to re-introduce those boundaries in my own life.
I’ve always been very strict about what apps can send me notifications – only things that really demand my attention. That includes messages from people I really care about, on-call pages from work, and extreme weather warnings. Breaking news, chatty group chats, and in-app marketing don’t make the cut.
I wore an Apple Watch for a while, primarily for the health features, but even with my limited notifications, it still became a distraction. Too many quiet moments with my partner were disturbed by a gentle buzz from my wrist – tiny demands for my attention that just weren’t worth the interruption. I’m currently trying a screenless fitness tracker, which sits silently on my wrist and never demands my attention.
My primary computer is now a desktop with a large monitor, and I’m fortunate to have a room I can use as an office. I also have a laptop, but I only use it when I leave the house – otherwise, it lives in a drawer under my desk.
My phone lives on a charging stand in my office, and I leave it there when I sleep. I also leave it there when I’m around the house, if I’m not waiting for something immediate like a phone call. I’ve actually taken to wearing skirts and dresses that don’t have pockets while I’m at home, to remind me to leave my phone at my desk.
There’s a growing trend among Gen Z to resist the all-in-one allure of the smartphone, and go back to dedicated devices. They’re swaping their smartphones for single-purpose tools like point-and-shoto cameras or dedicated MP3 players, devices that lack the ability to receive notifications. I haven’t gone that far yet, but it’s something I’m considering.
My computers are no longer something that follow me around – they’re confined to one room, and they can only get my attention when I’m in that room and working at my desk. The rest of the time, they can ping as loudly as they like, but I won’t hear it.
Since I started making these changes, I’ve felt calmer and more relaxed, especially when I’m at home. I can focus on the things that actually deserve my attention – cooking a meal, reading a book, chatting with my friends, playing on the sofa. I’m less worried about the distraction of my digital devices, or the effect it has on my life.
The computer room disappeared because we wanted more convenience, more ease, and less friction in our computing lives. But after a year of rebuilding those walls, I’m reminded that friction isn’t always a bad thing – it slows me down, but it also slows down the companies competing for my attention.
I don’t mind the extra steps it takes to reach my computer; I’ve become grateful for the distance. When I walk into my office and sit at my desk, I’m choosing to be there. When I walk away, I have a door I can close, and a life outside the room that the digital world is no longer allowed to reach.
[If the formatting of this post looks odd in your feed reader, visit the original article]